Unveiling the Invisible: Mastering Unknowns in Business Operations
credits: Created with the help of DALL-E 3
Deviations in metrics such as GMV, sales, or conversion rates are typically reactive indicators. Companies usually become aware of these changes after they have already made an impact, often when the damage is already done. In many instances, due to limited visibility, businesses may struggle to understand these variances. In other cases, they might completely overlook such deviations.
For example, a reduction in operations in a particular region could be attributed to a range of factors including operational challenges, inventory issues, or supply chain disruptions.
The challenge of business observability has been a compelling problem for many decades. In recent years, a number of innovative solutions have emerged to address this issue. AI-powered tools, in particular, have simplified the process for businesses to identify these unknowns, without requiring extensive time investment.
In this blog, I will discuss a tool I have been experimenting with called PerceptInsight (PI). I aim to provide a detailed walkthrough of how this tool effectively assists in uncovering and understanding the unknowns in business operations.
1. Integrate with PI
PerceptInsight (PI) provides seamless integration with various UI and server frameworks through their comprehensive SDKs. For more details, you can explore their documentation on integrations at PerceptInsight Integrations.
Instrumenting the Right Events
This step is crucial, as it involves ensuring that all necessary events are instrumented for data capture.
In this blog, I will use the example of a digital commerce platform to illustrate this process. Imagine a user journey where a customer discovers products, adds them to their cart, and ultimately makes a purchase. Let’s break down the key events to track:
-
APP_OPENS: This fundamental event is triggered every time the app is opened. It captures user information as properties.
-
HOME_PAGE: The main landing page of the app.
-
CATEGORY_HOME: This event represents the homepage for a specific product category or vertical within the platform.
-
LISTING_VIEW: Triggered for each product listing impression on the platform.
-
ADD_TO_CART: This event is activated when a user adds an item to their shopping cart.
-
ORDER_PLACED: Recorded each time an order is finalized and placed.
With these events instrumented, we’re set to move on to the next step of the process.
2. Building Insights
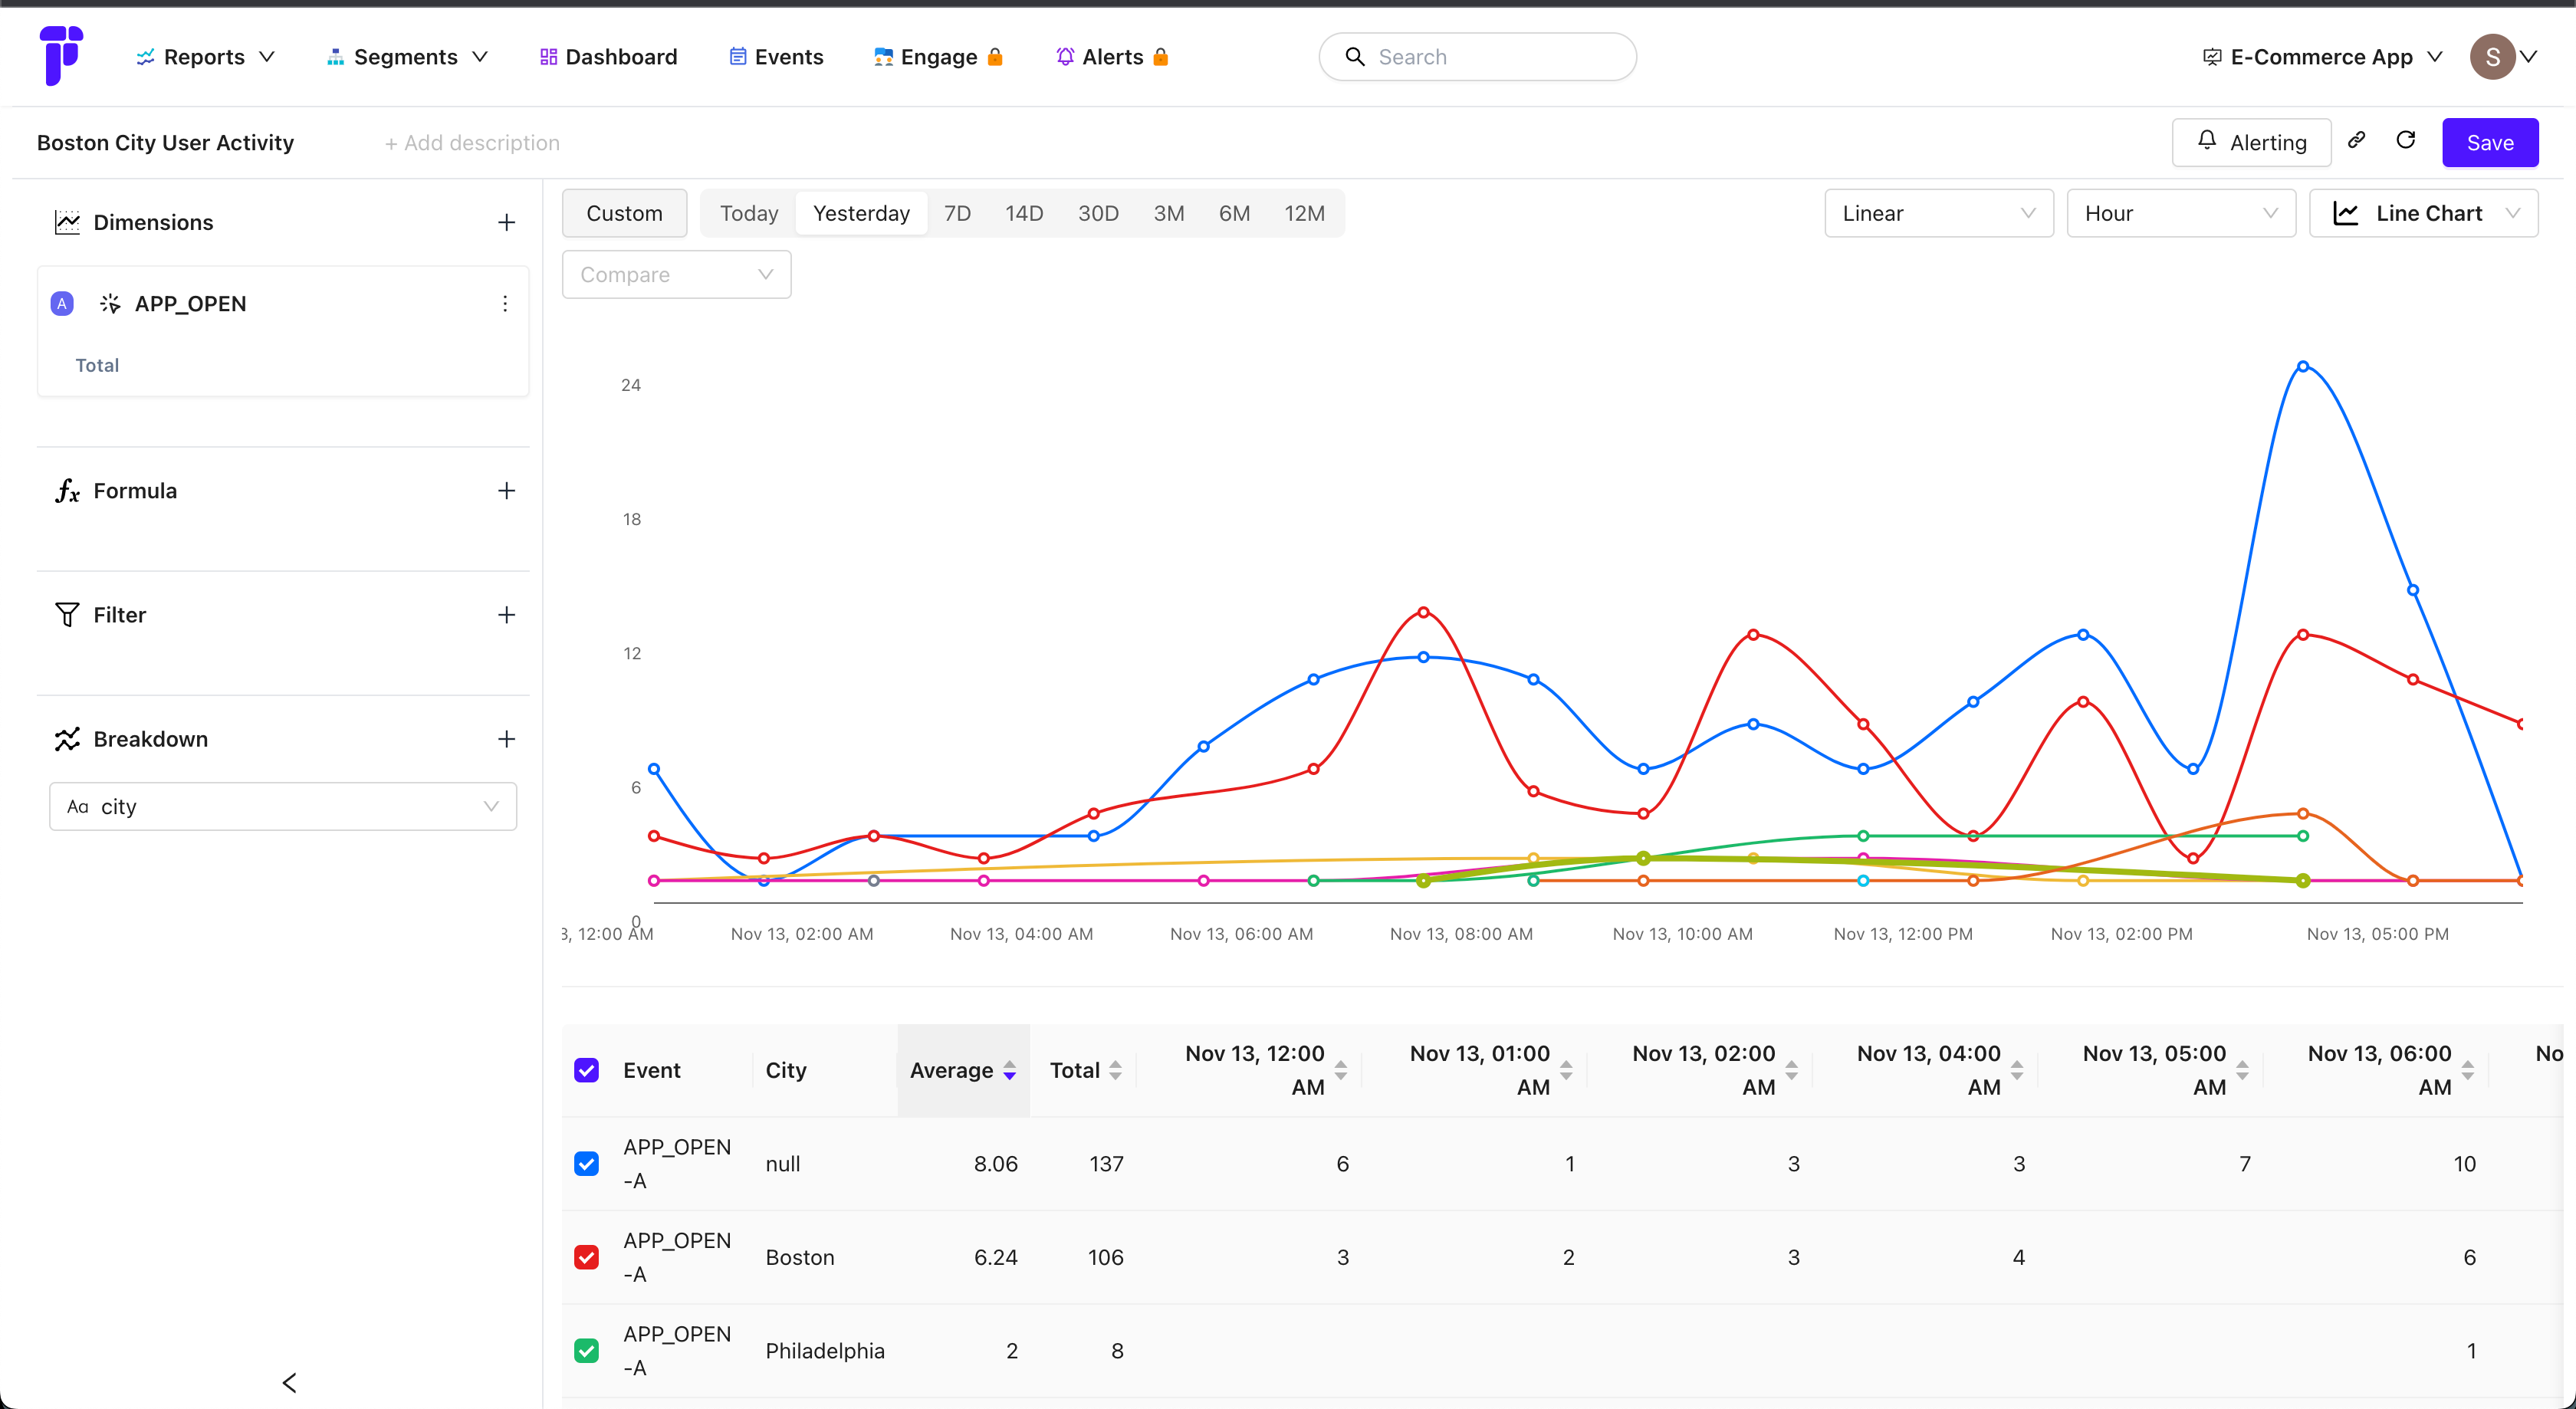
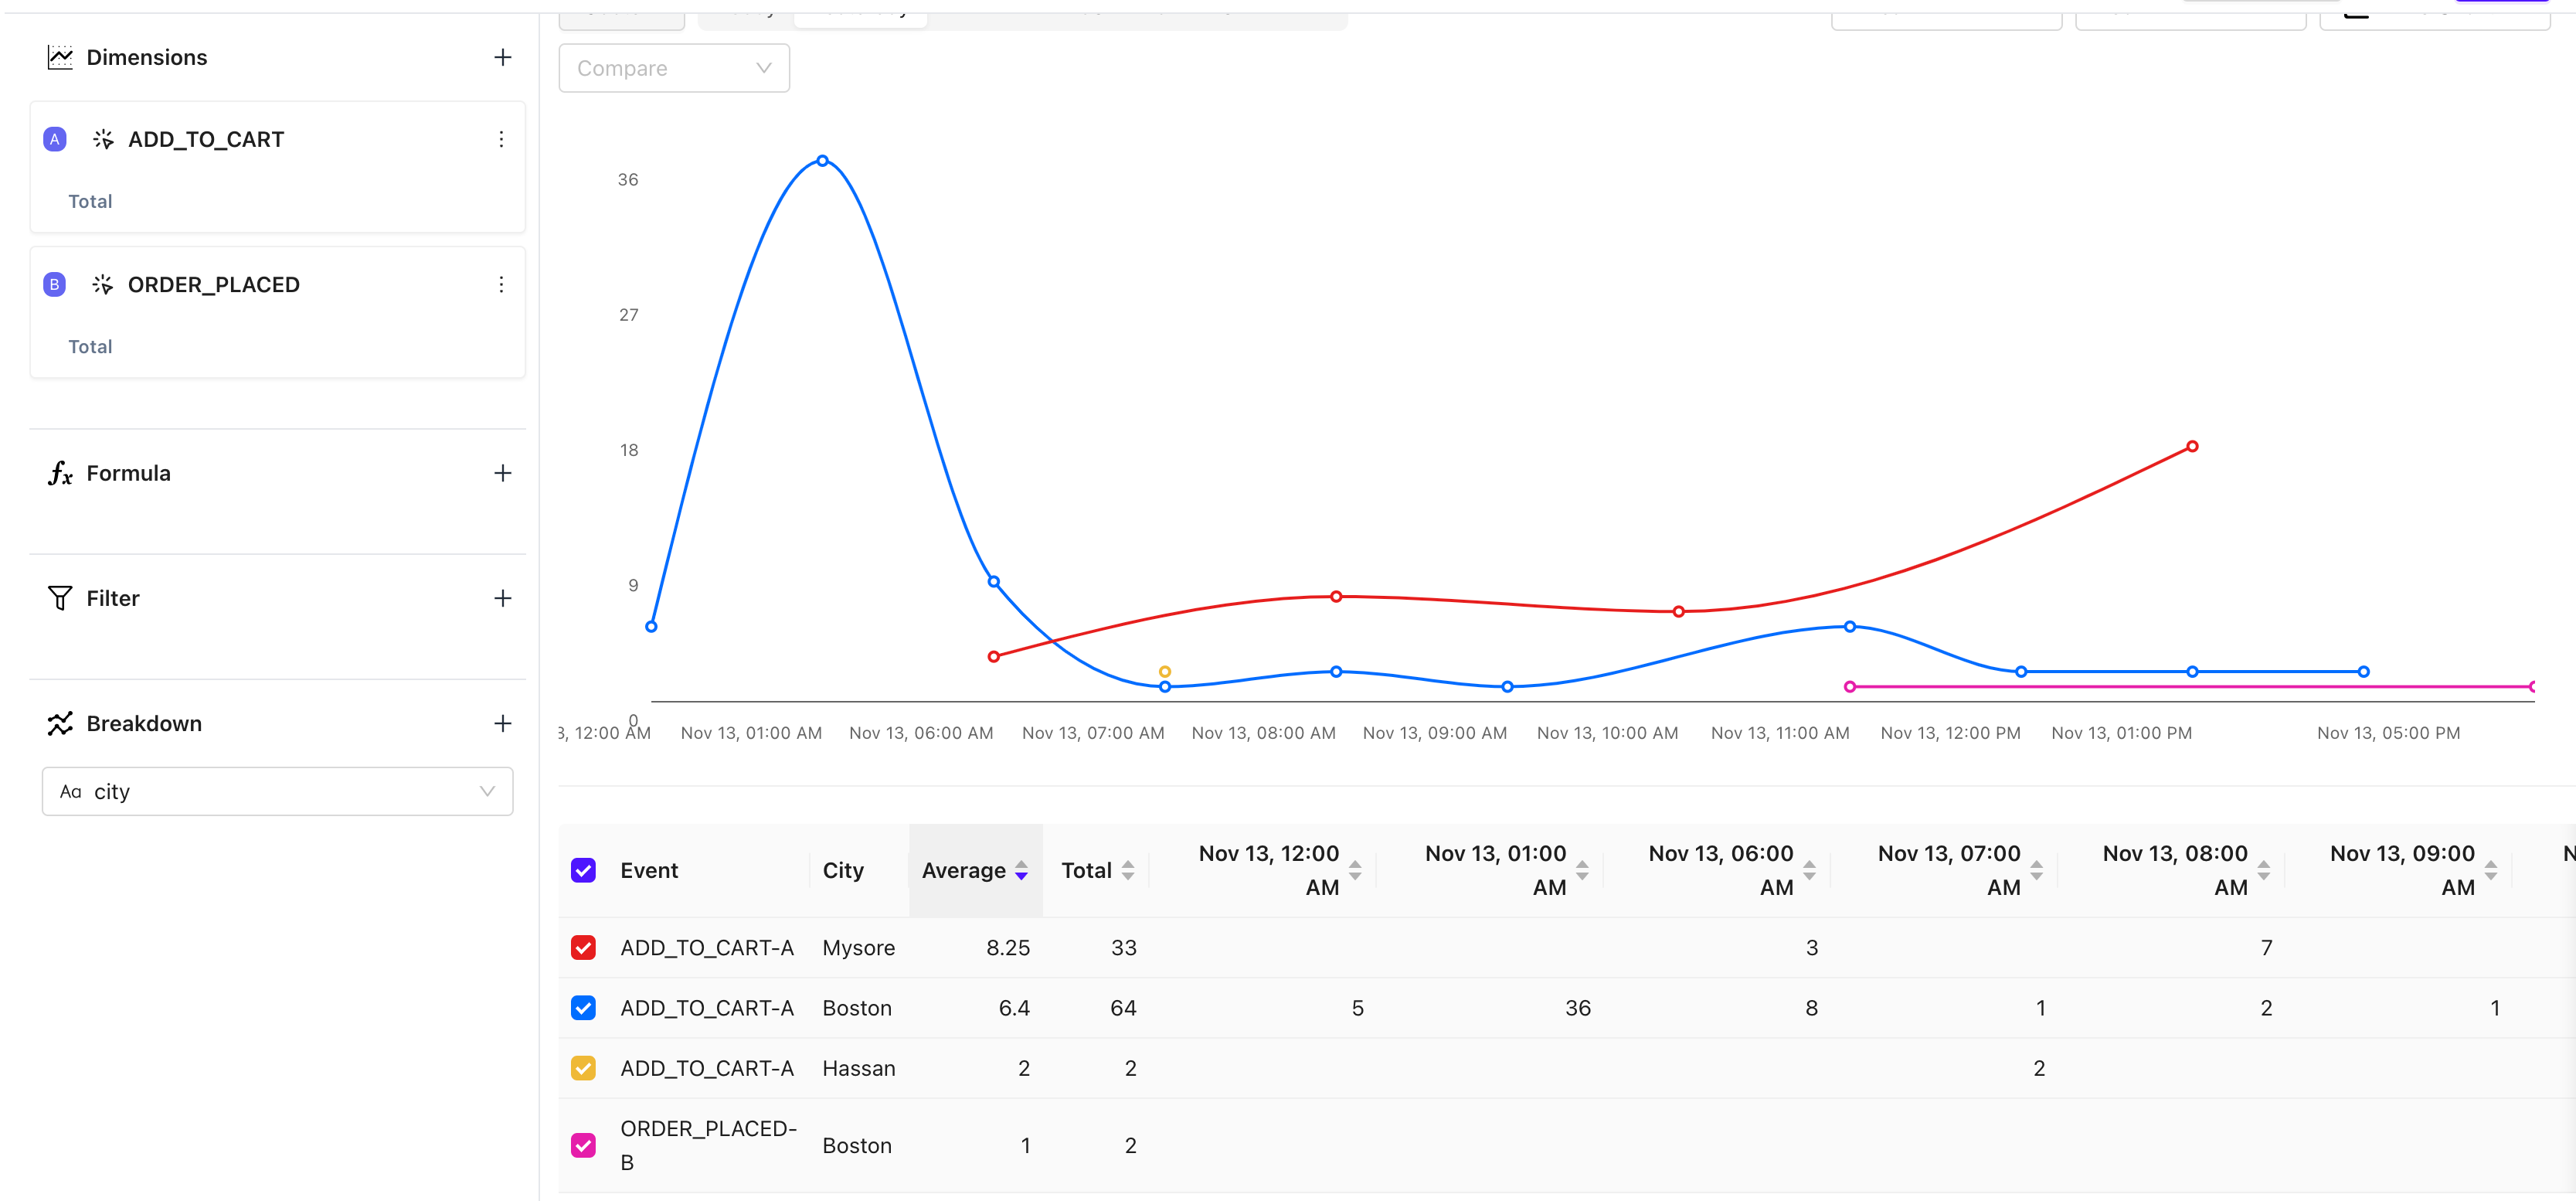
We begin by constructing a few foundational insights, such as tracking App Activity by City and analyzing Orders Placed across different cities.
With PI, accomplishing this becomes remarkably straightforward. Thanks to the previously instrumented events, these insights can be effortlessly generated by selecting relevant options from PI’s ‘Insights’ feature. This functionality enables quick and efficient data analysis with just a few clicks


3. Enabling Automated Anomaly Detection
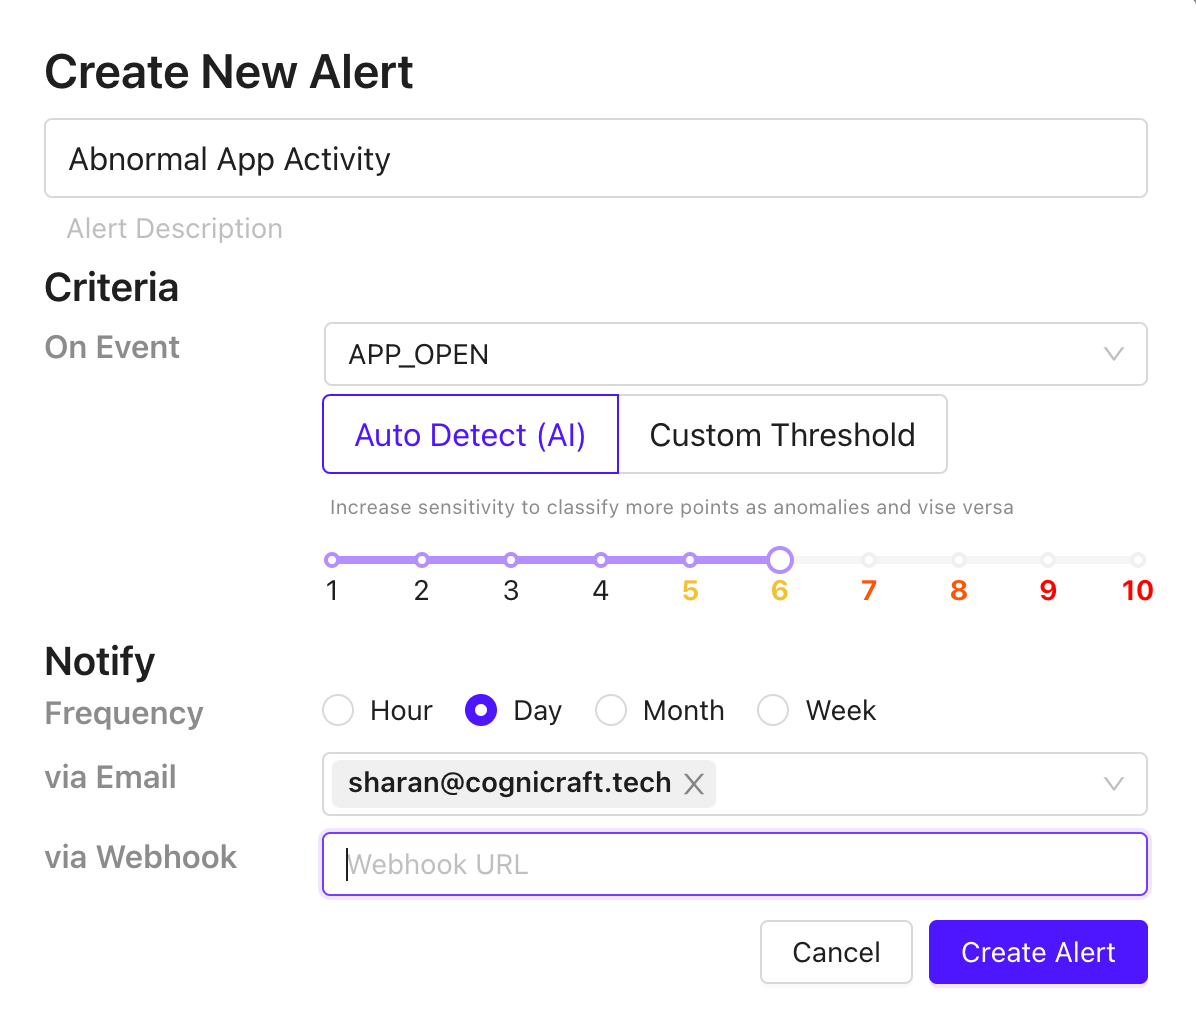
In addition to the dashboard that provides daily insights, we now integrate AI-based anomaly detection, as illustrated in the image below:

PerceptInsight’s (PI’s) anomaly detection system is designed to automatically identify seasonal patterns and variations in trends within the data. Depending on the sensitivity settings we chose, it effectively pinpoints anomalous data points. Moreover, it promptly notifies us through on the preferred communication channel.
One of the standout features of this process is its simplicity. It is user-friendly enough that even individuals without technical expertise or SQL knowledge can easily configure and build this entire insight pipeline.
Conclusion
The true potential of anomaly detection has often been underrated, primarily due to its complex implementation and a tendency to generate too many false positives. However, with tools like PerceptInsight (PI), this no longer appears to be a significant concern. The blend of configurability and ease of use that PI offers is a game-changer in this field.
Once set up, the system operates autonomously, requiring minimal to no manual intervention. It keeps us consistently informed about any irregularities or anomalies in our operations, ensuring that we are always on top of our business’s performance.
