Funnel Analysis and User Drop-Off
What is Funnels Analysis and Why is It So Important?
Think of Funnels as a staircase that your users take. Now funnel analysis is the feature that enables you to track every step of your user journey within an app or website. From app visits to purchases. But it’s not just limited to that. With Funnel analysis, you can also spy on those spots where the app users get distracted and drop-off. Let us dive deep into the world of funnel analysis and learn how it can be used to track user drop-offs - The PI way!
Understand Where Users are Dropping Off.
Our client's website is the talk of the town, getting a healthy number of visitors. Hooray! But hold on to your hats, partners, the marketing team uncovered a shocking truth - while the website visits are doing a victory dance, they aren't exactly turning into sales. Those visitors are just window shopping!
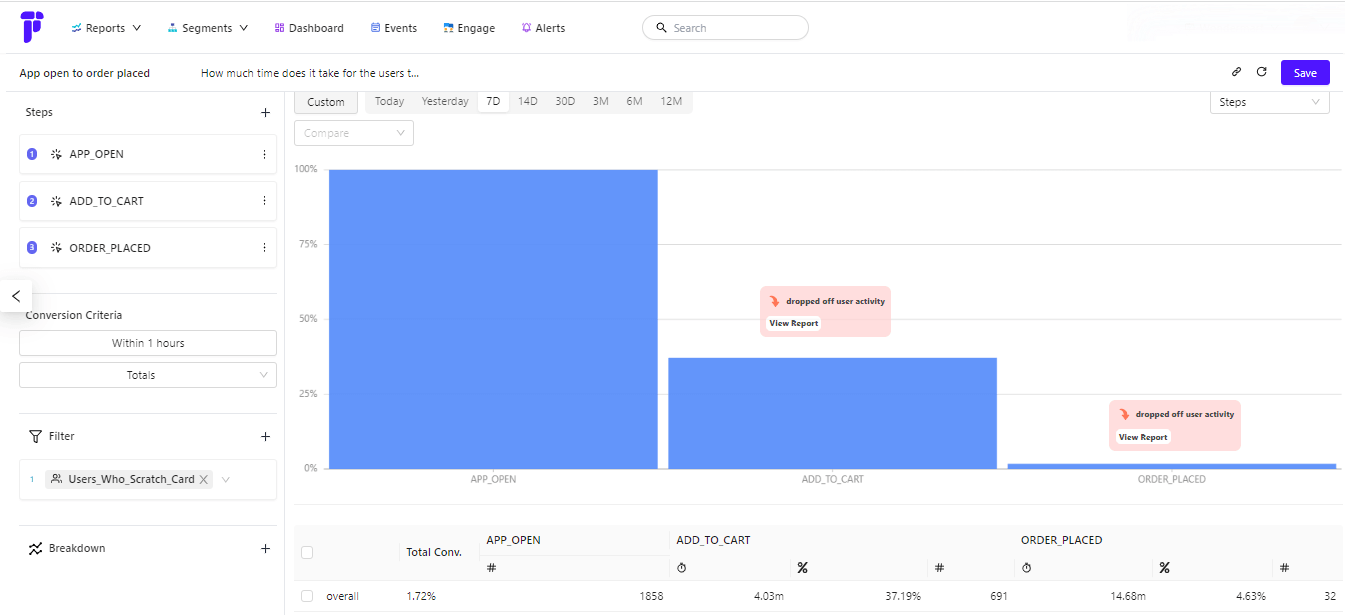
Check out the image below - PI allows you to figure out users’ last activity on your platform.
The first bar shows the total number of app visitors, the second bar shows how many actually added the product to their cart, and the last bar? Well, that's how many shoppers went all the way and placed an order.
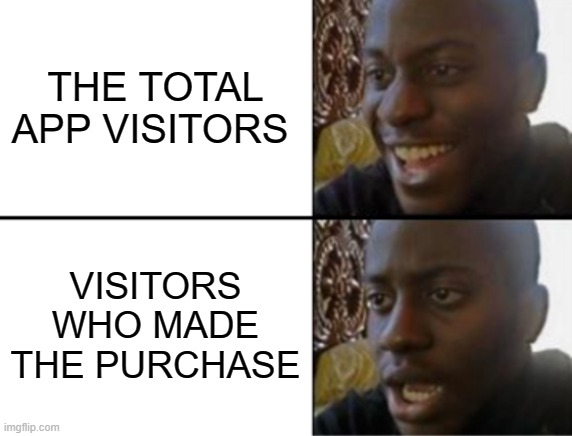
Did you catch the emotional tornado?
We understand how it feels like.
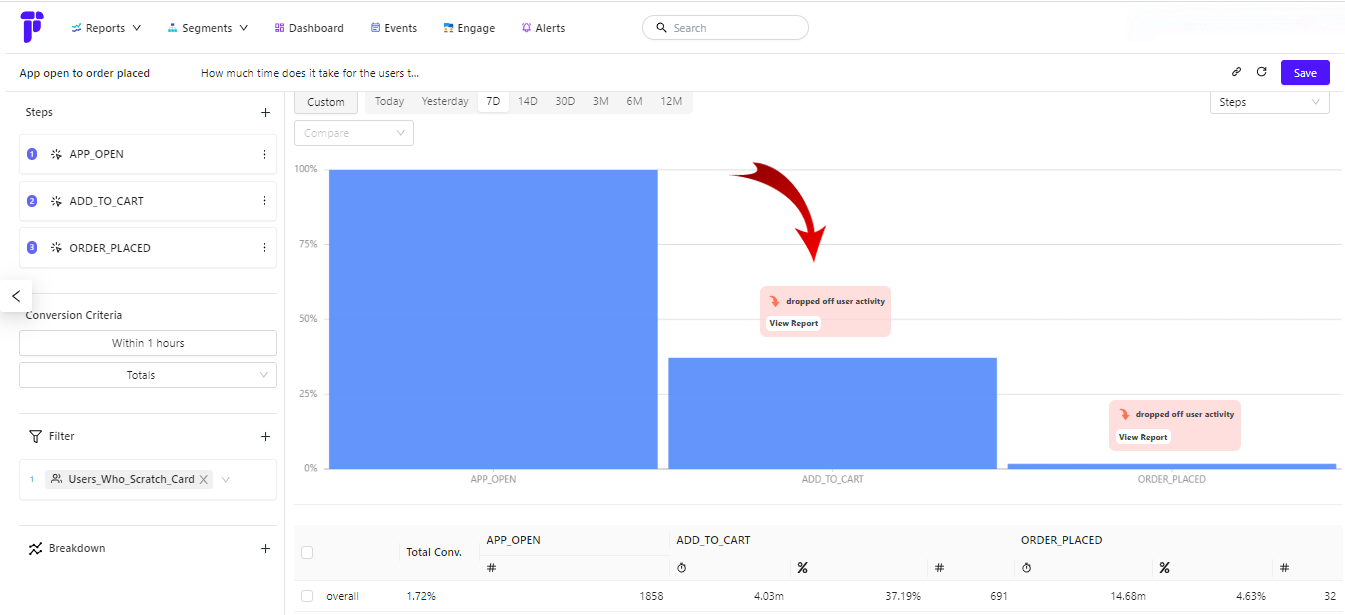
So, where are the users mostly spending their time and drifting without making a purchase?
How Does Percept Insight Help you Fathom the user drop-off mystery?
Just click on "view report" at each step and share it with your team to discover where users are lingering the longest. This intel will help your team understand user behavior like never before.
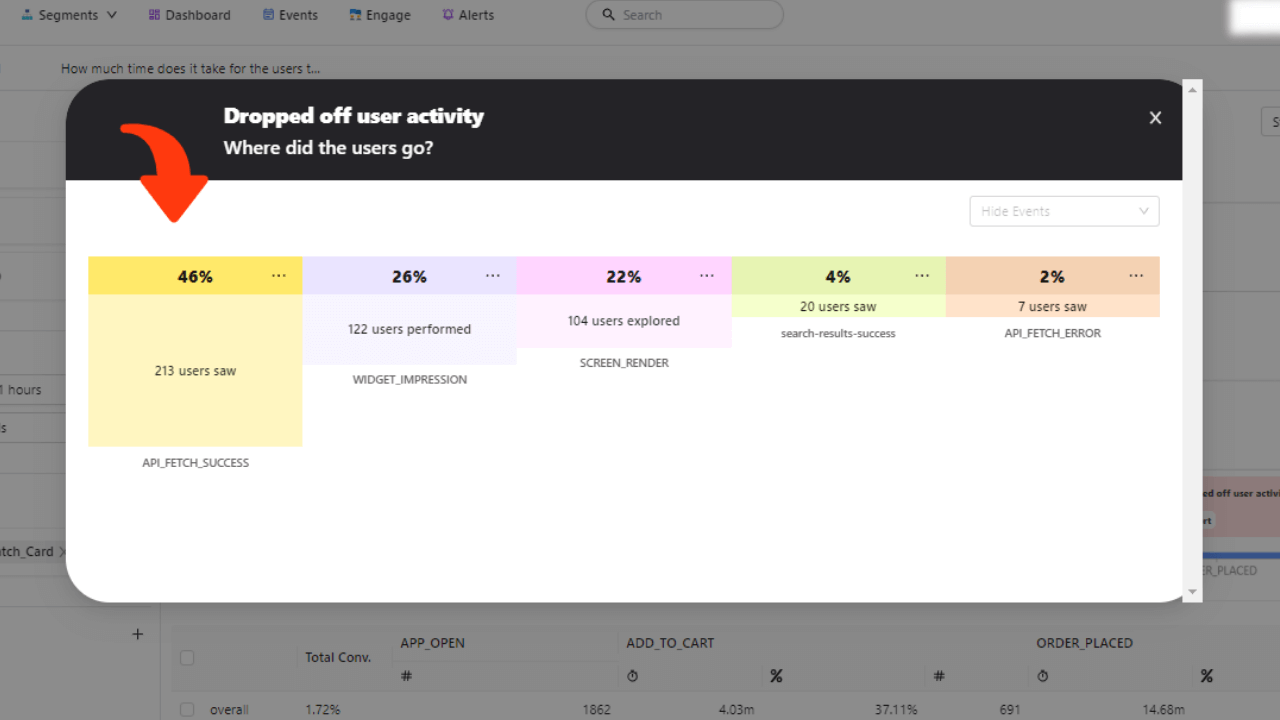
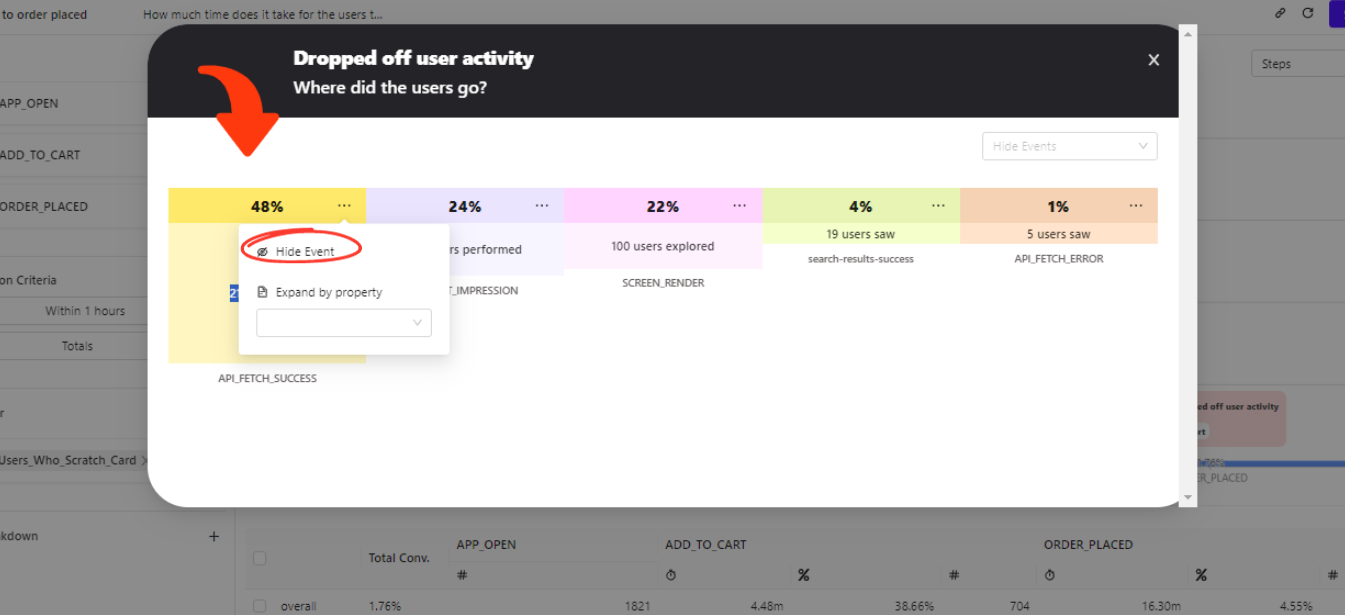
View Complete User Activity
By clicking the “view report” you get to see the details such as where the visitors mostly spend their time. With this insightful view of user drop-off, you can now enhance engagement and build strategies to retain them.
Flexible Funnel Analysis with Percept Insight (PI) - In Just 3 Steps
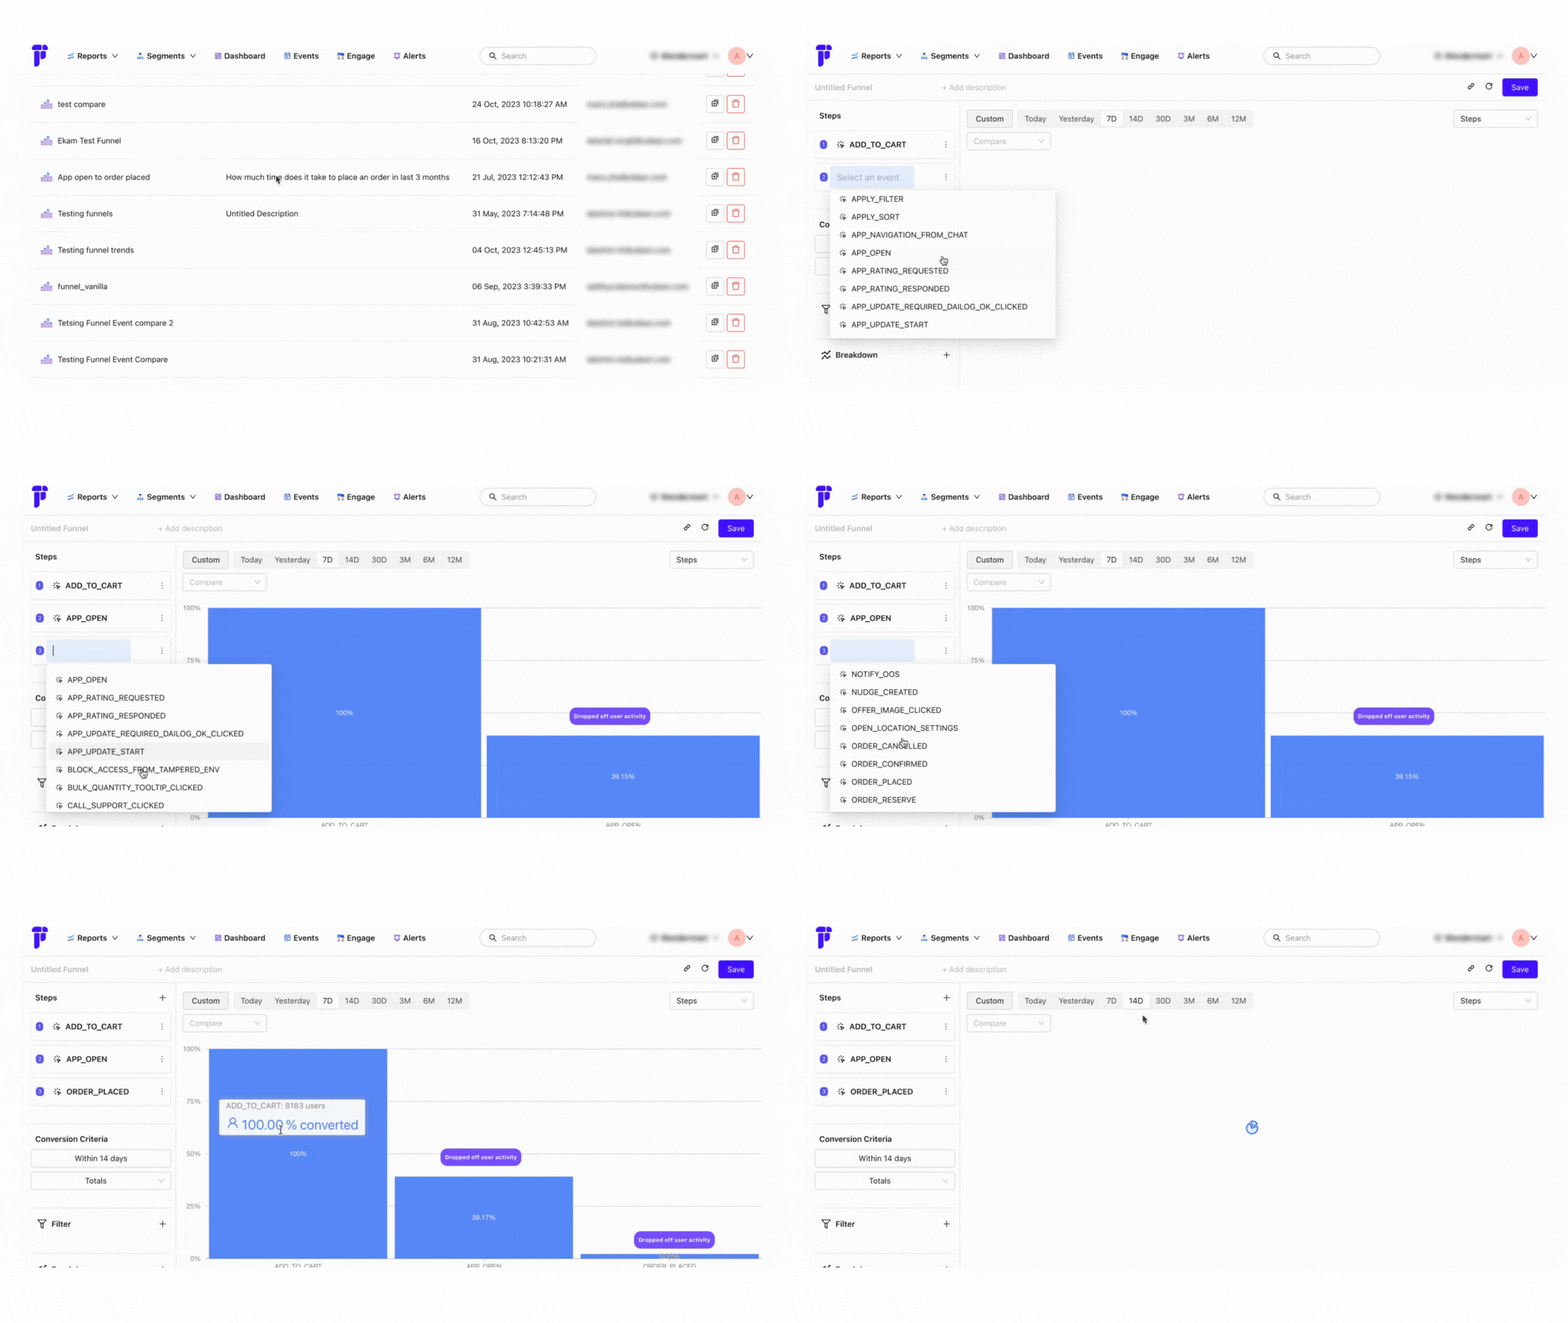
Here is the guide that lets you understand how easy the whole process is.
Step 1: Navigate to the 'Add' button and proceed to the subsequent steps to create your own funnel for analysis (You can select the time frame from the most recent up to a year)
Step 2: Choose the event for analysis – in this instance, we've opted for 'Add to Cart,' 'App Open,' and 'Order Placed.’
Step 3: Witness the insights unfold through a visually intuitive bar graph presentation.
Bonus: You can also hide events that aren't relevant to your analysis and personalize your analysis experience. And don’t worry you do not require any coding to generate reports!
Conclusion
Funnels help businesses guide customers from awareness to conversion in a complex journey. Businesses can unlock growth opportunities, improve customer experiences, and drive revenue by carefully analyzing each stage, tracking user behavior, testing variations, and considering integrated funnels.
So, whether you're a small business owner or a marketing professional, take the time to analyze and optimize your funnels. Embrace the power of data-driven insights and set yourself on the path to success.
Now it's your turn! Have you conducted funnel analysis for your business using PI? If not then book a demo today!