User Conversion & Drop Offs
Monitoring user conversions and drop-offs is crucial for every organization. We are surrounded by digital analytics, and in this world, data-driven decisions are paramount. Hence, having the right analytics tools is essential for every business.
Percept Insight, is a tool that can help you transform your business's perceptibility with just a couple of clicks. In this exemplary guide, let us explore how to build conversion storyboards for your business platform using Percept Insight.
Add to Cart Funnel
The funnel below clearly displays that the Add to Cart conversion among the total app visits was 18%.
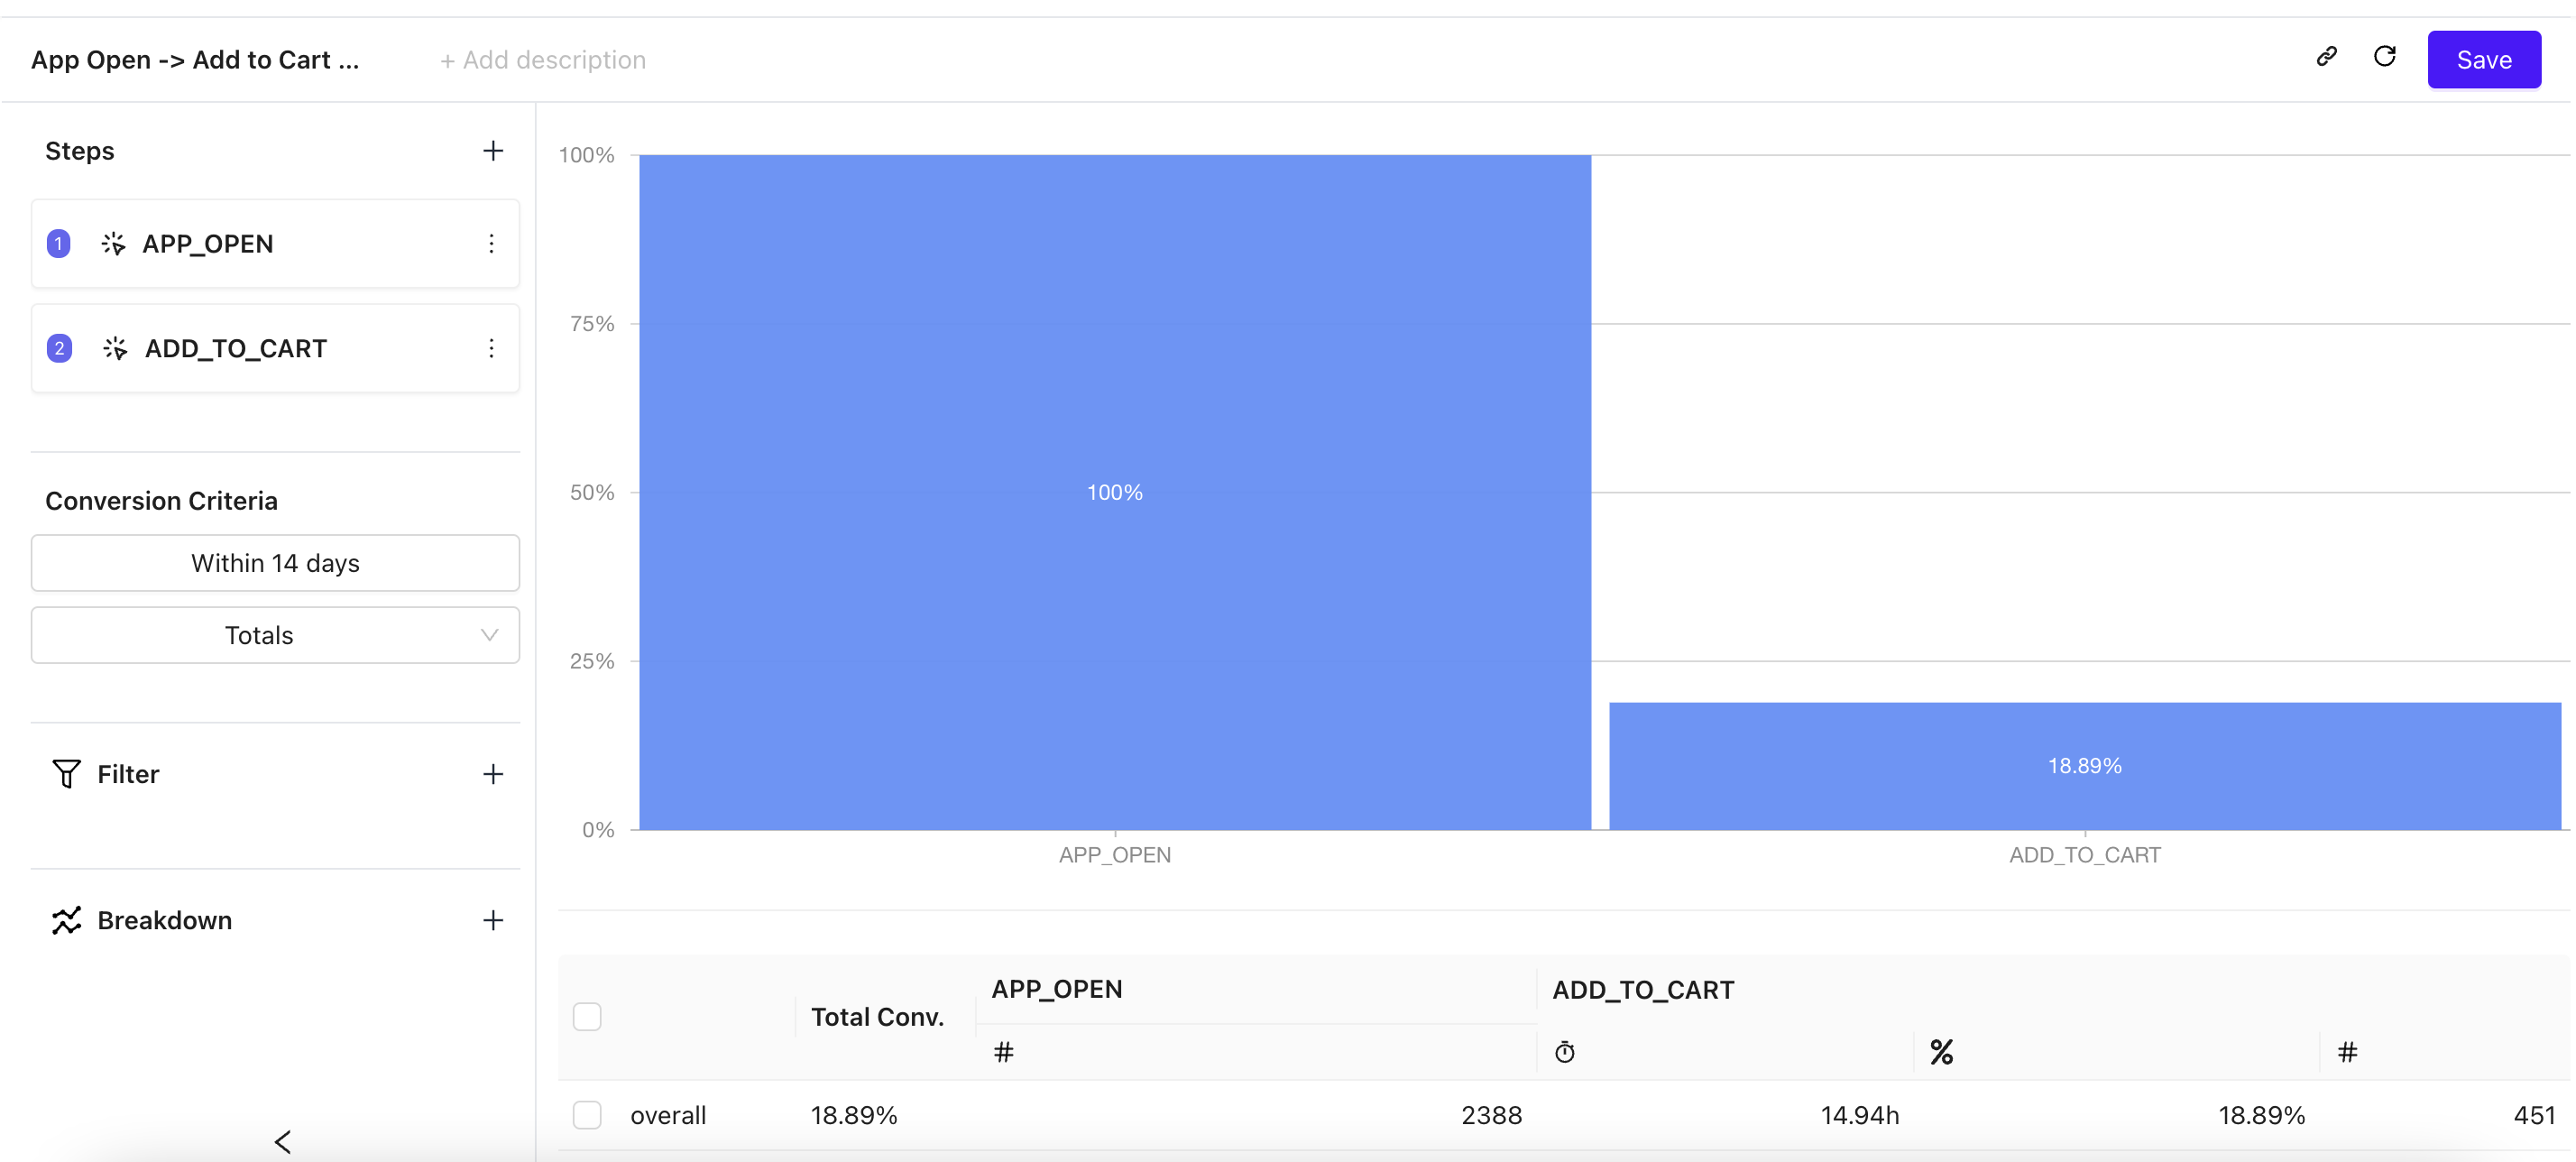
By updating the conversion criteria,(configured with a default 14-day window), we can measure the percentage of users who successfully convert within any time intervals.
This information can assist product designers and owners to modify or enhance their app buyer path, and drive faster conversions.
Multiple step funnels
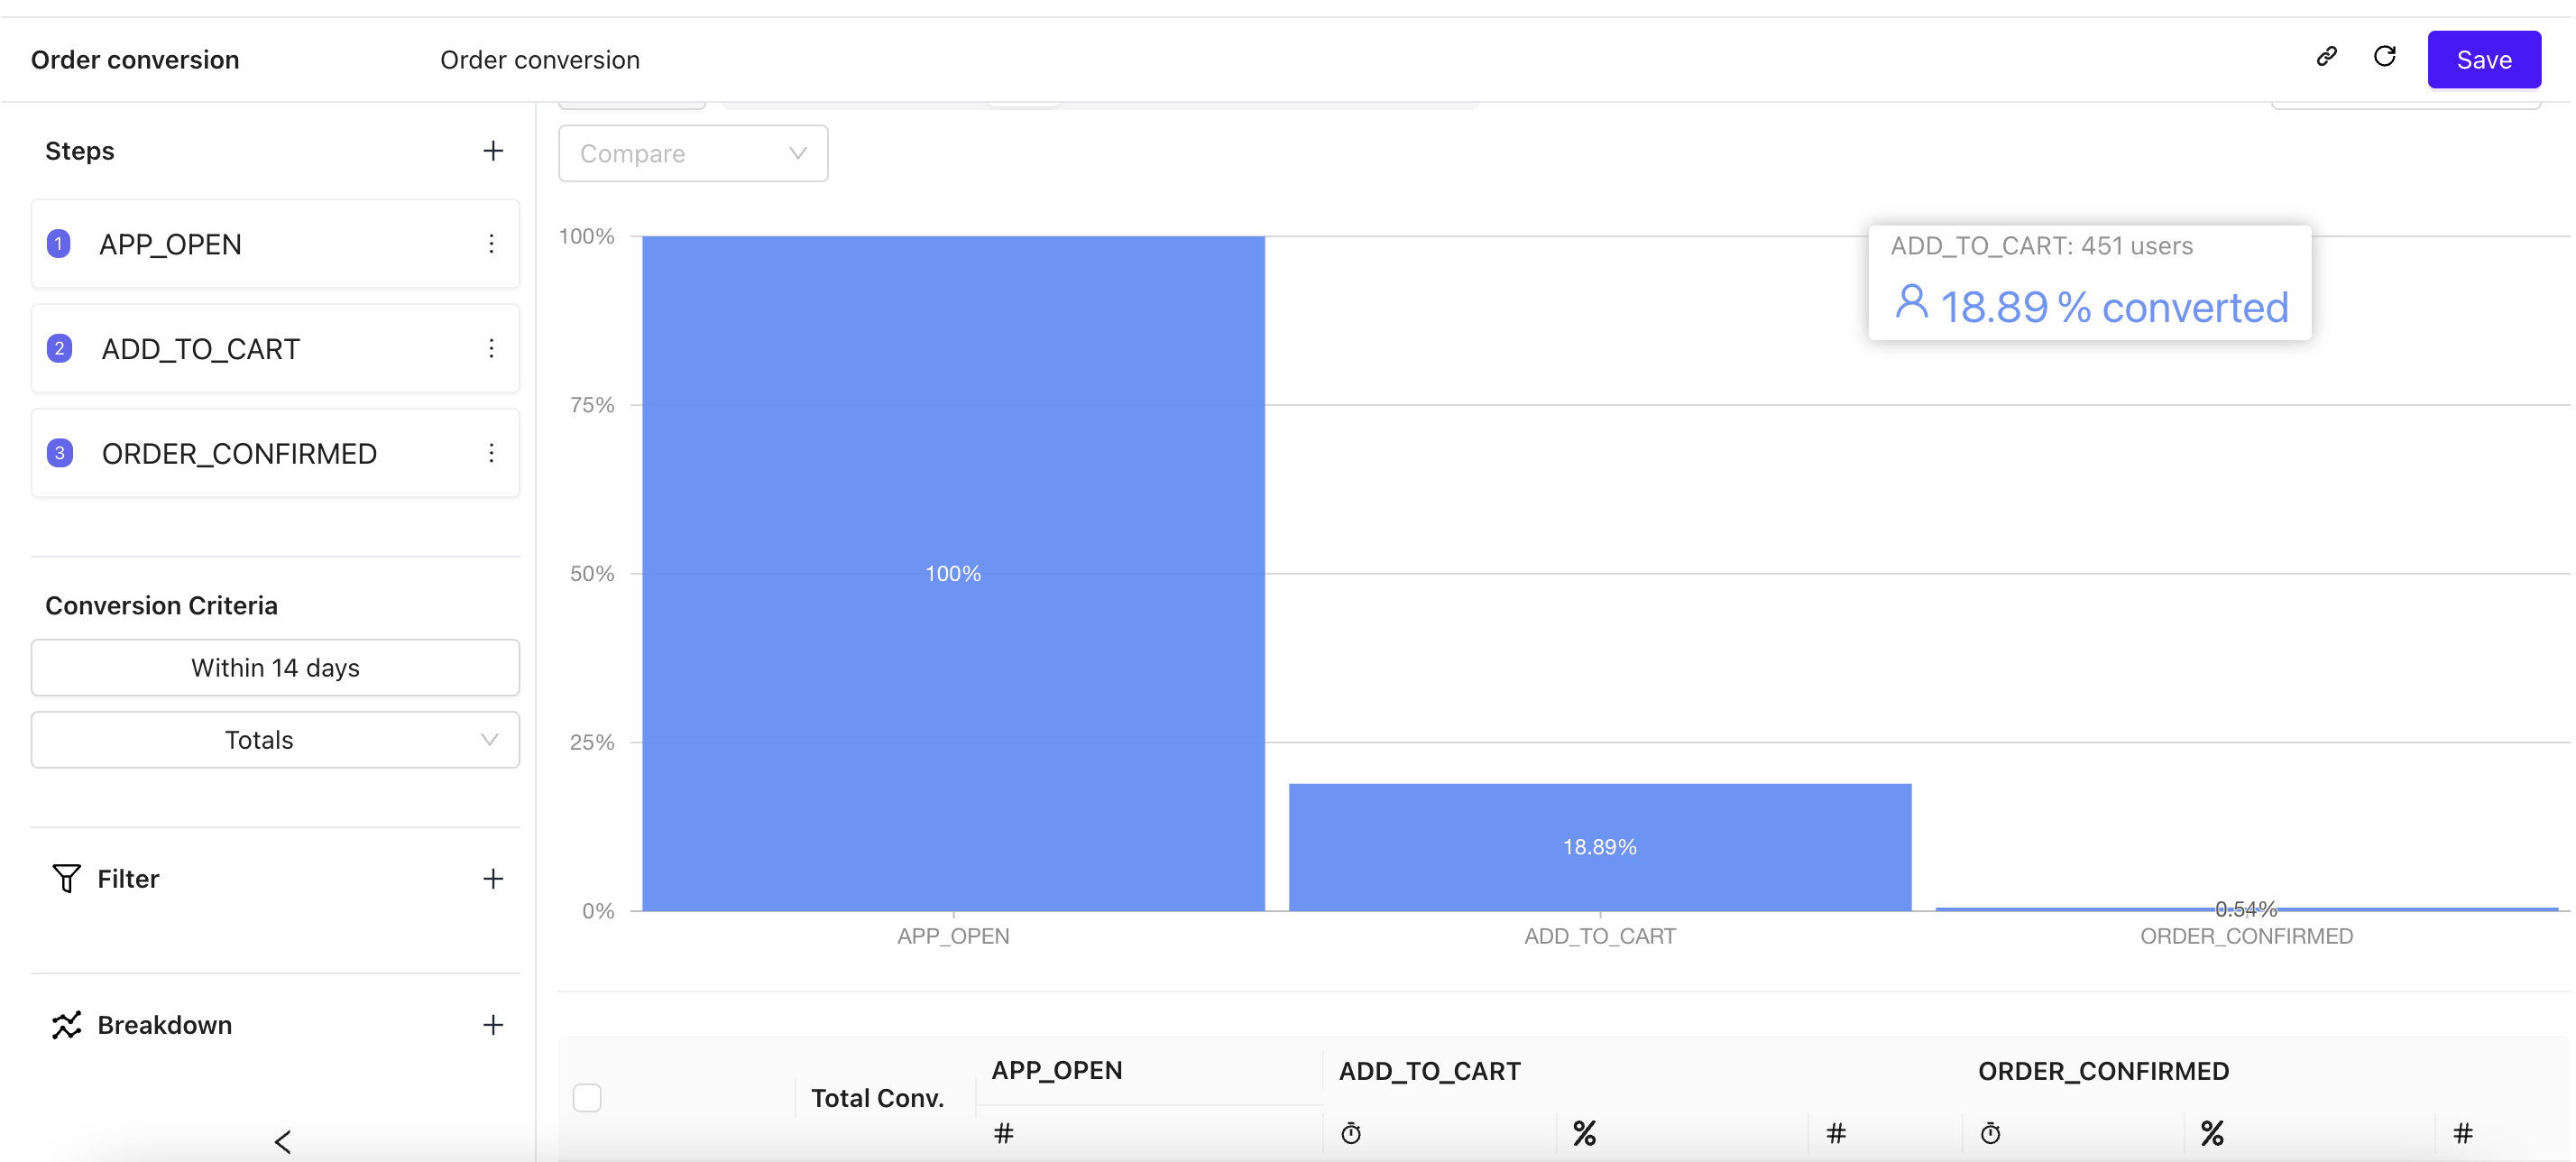
Here this shows us that, even though 18% of the buyers perform add to cart, but only 0.54% of them are actually placing the order within 14 days window.
Conversions with unique buyers
Apart from this, PI can also help in measuring the unique users who converted in the said duration, just with the click of a button
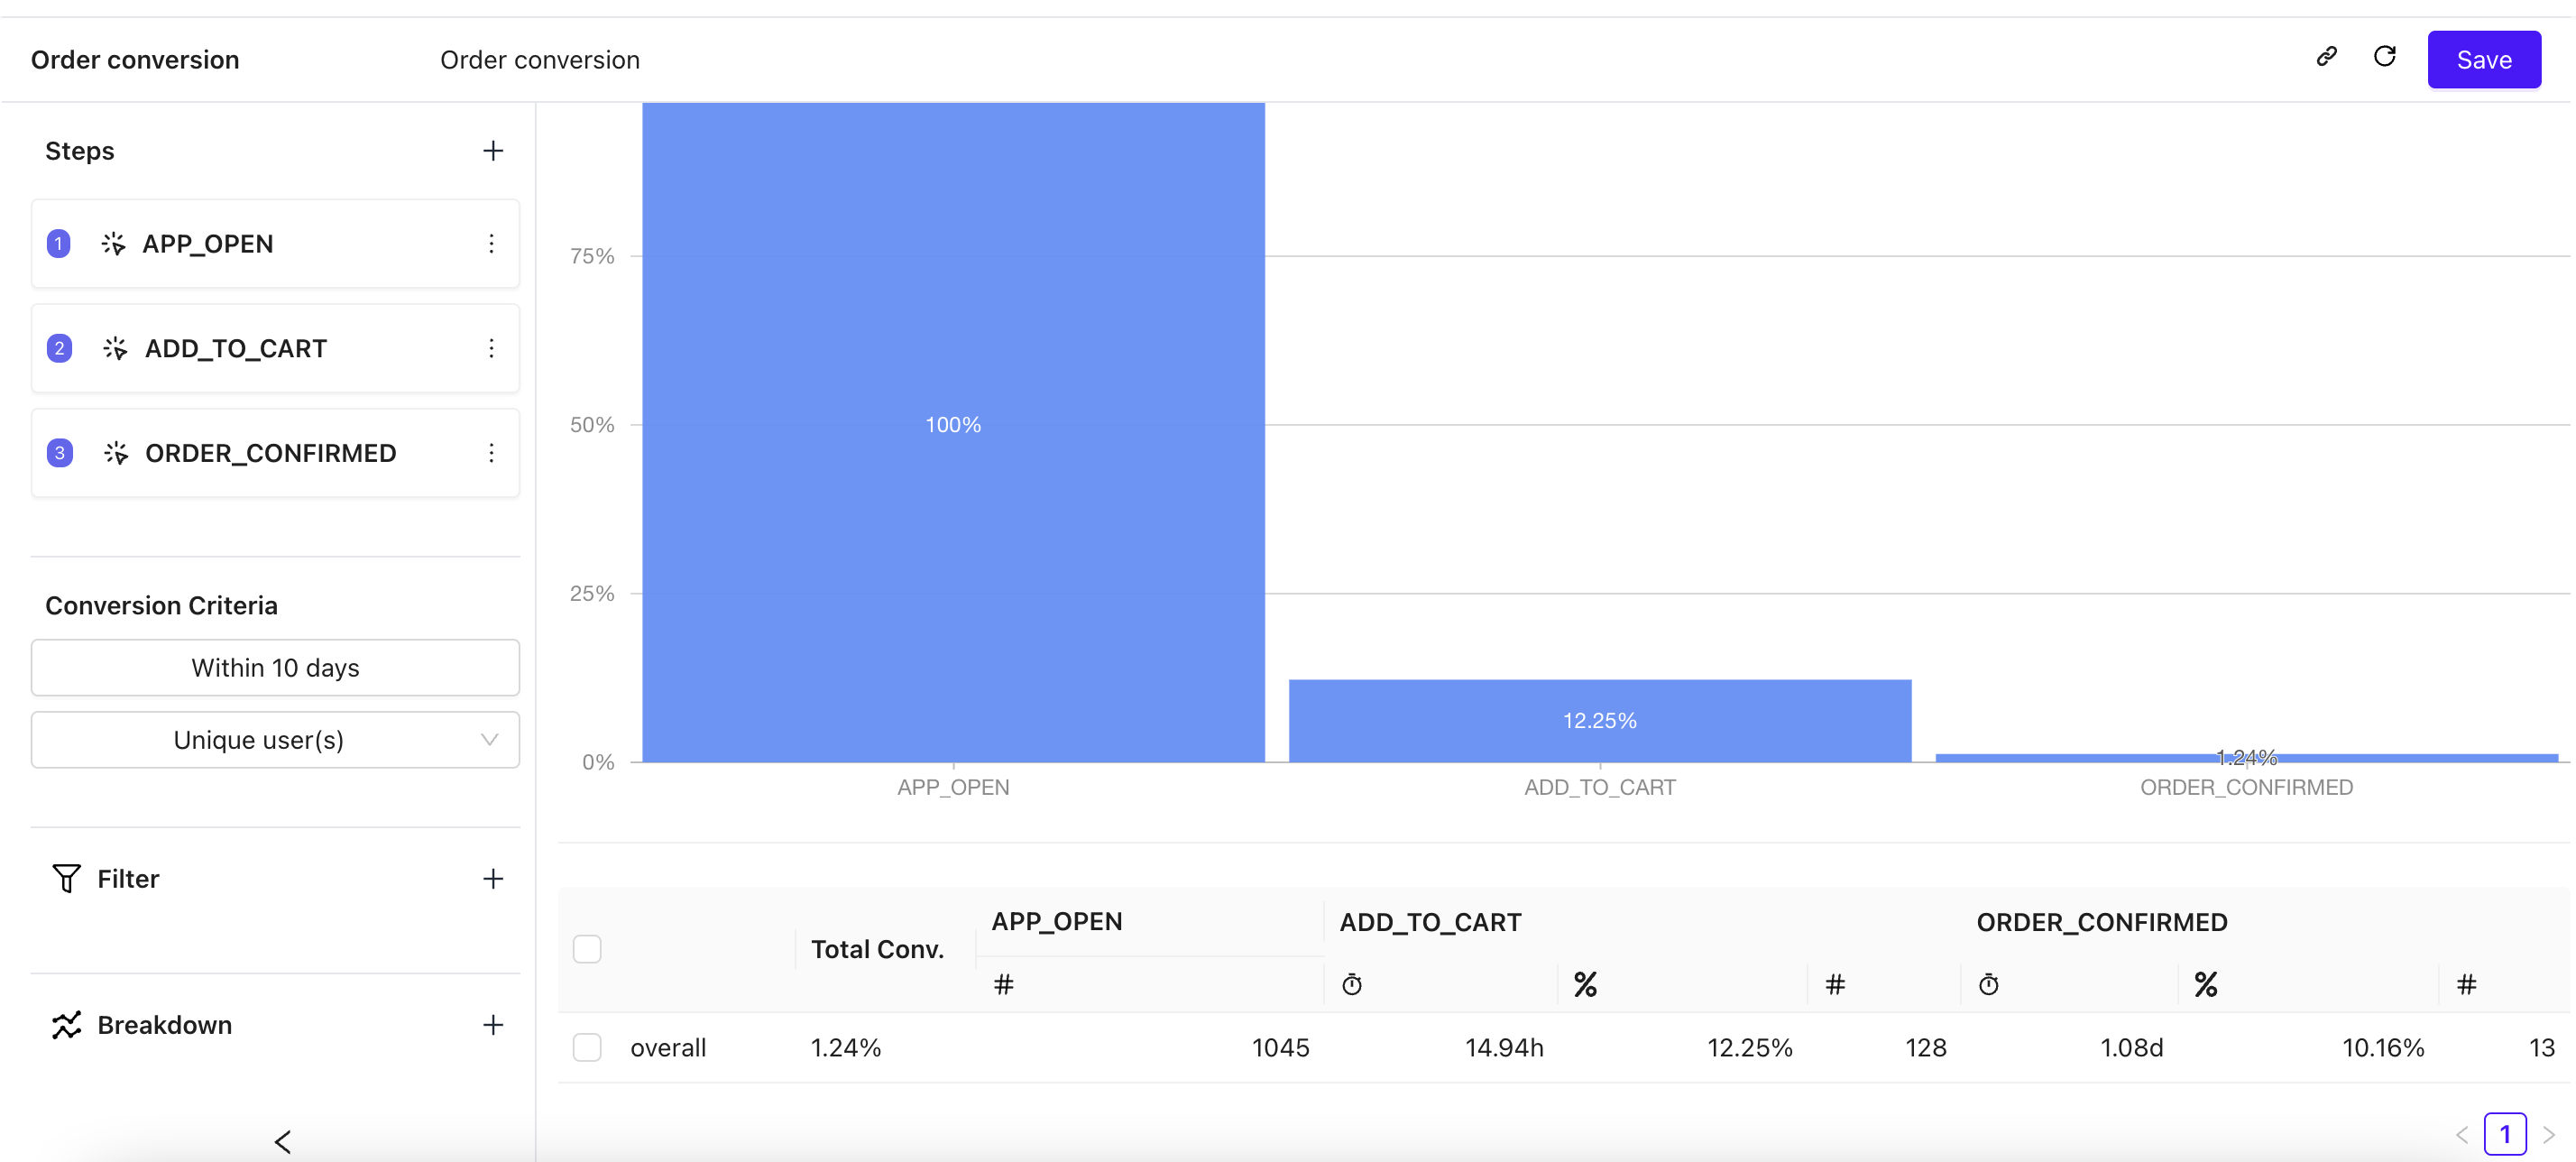
Now if we look at the same funnel from the lens of unique users. It’s evident that only 12.25% of users are actually adding items to cart. And nearly 1% of the users only convert to placing the order.
This capability gives us a differential view of traffic driven insights vs user driven insights. There by making the product decisioning more informed.
Conversions based on event properties
Assuming that there were multiple product iterations,
- How do we know the newer ones is giving better conversions than before?
- How do we benchmark and compare different versions of the app?
Once again, PI has got these covered with App Version tracking and integrated Funnel Drilldowns.
Below is a comparative funnel that indicates Version 6.2.1 yields the highest conversion rates, which provides positive validation for the app iterations.
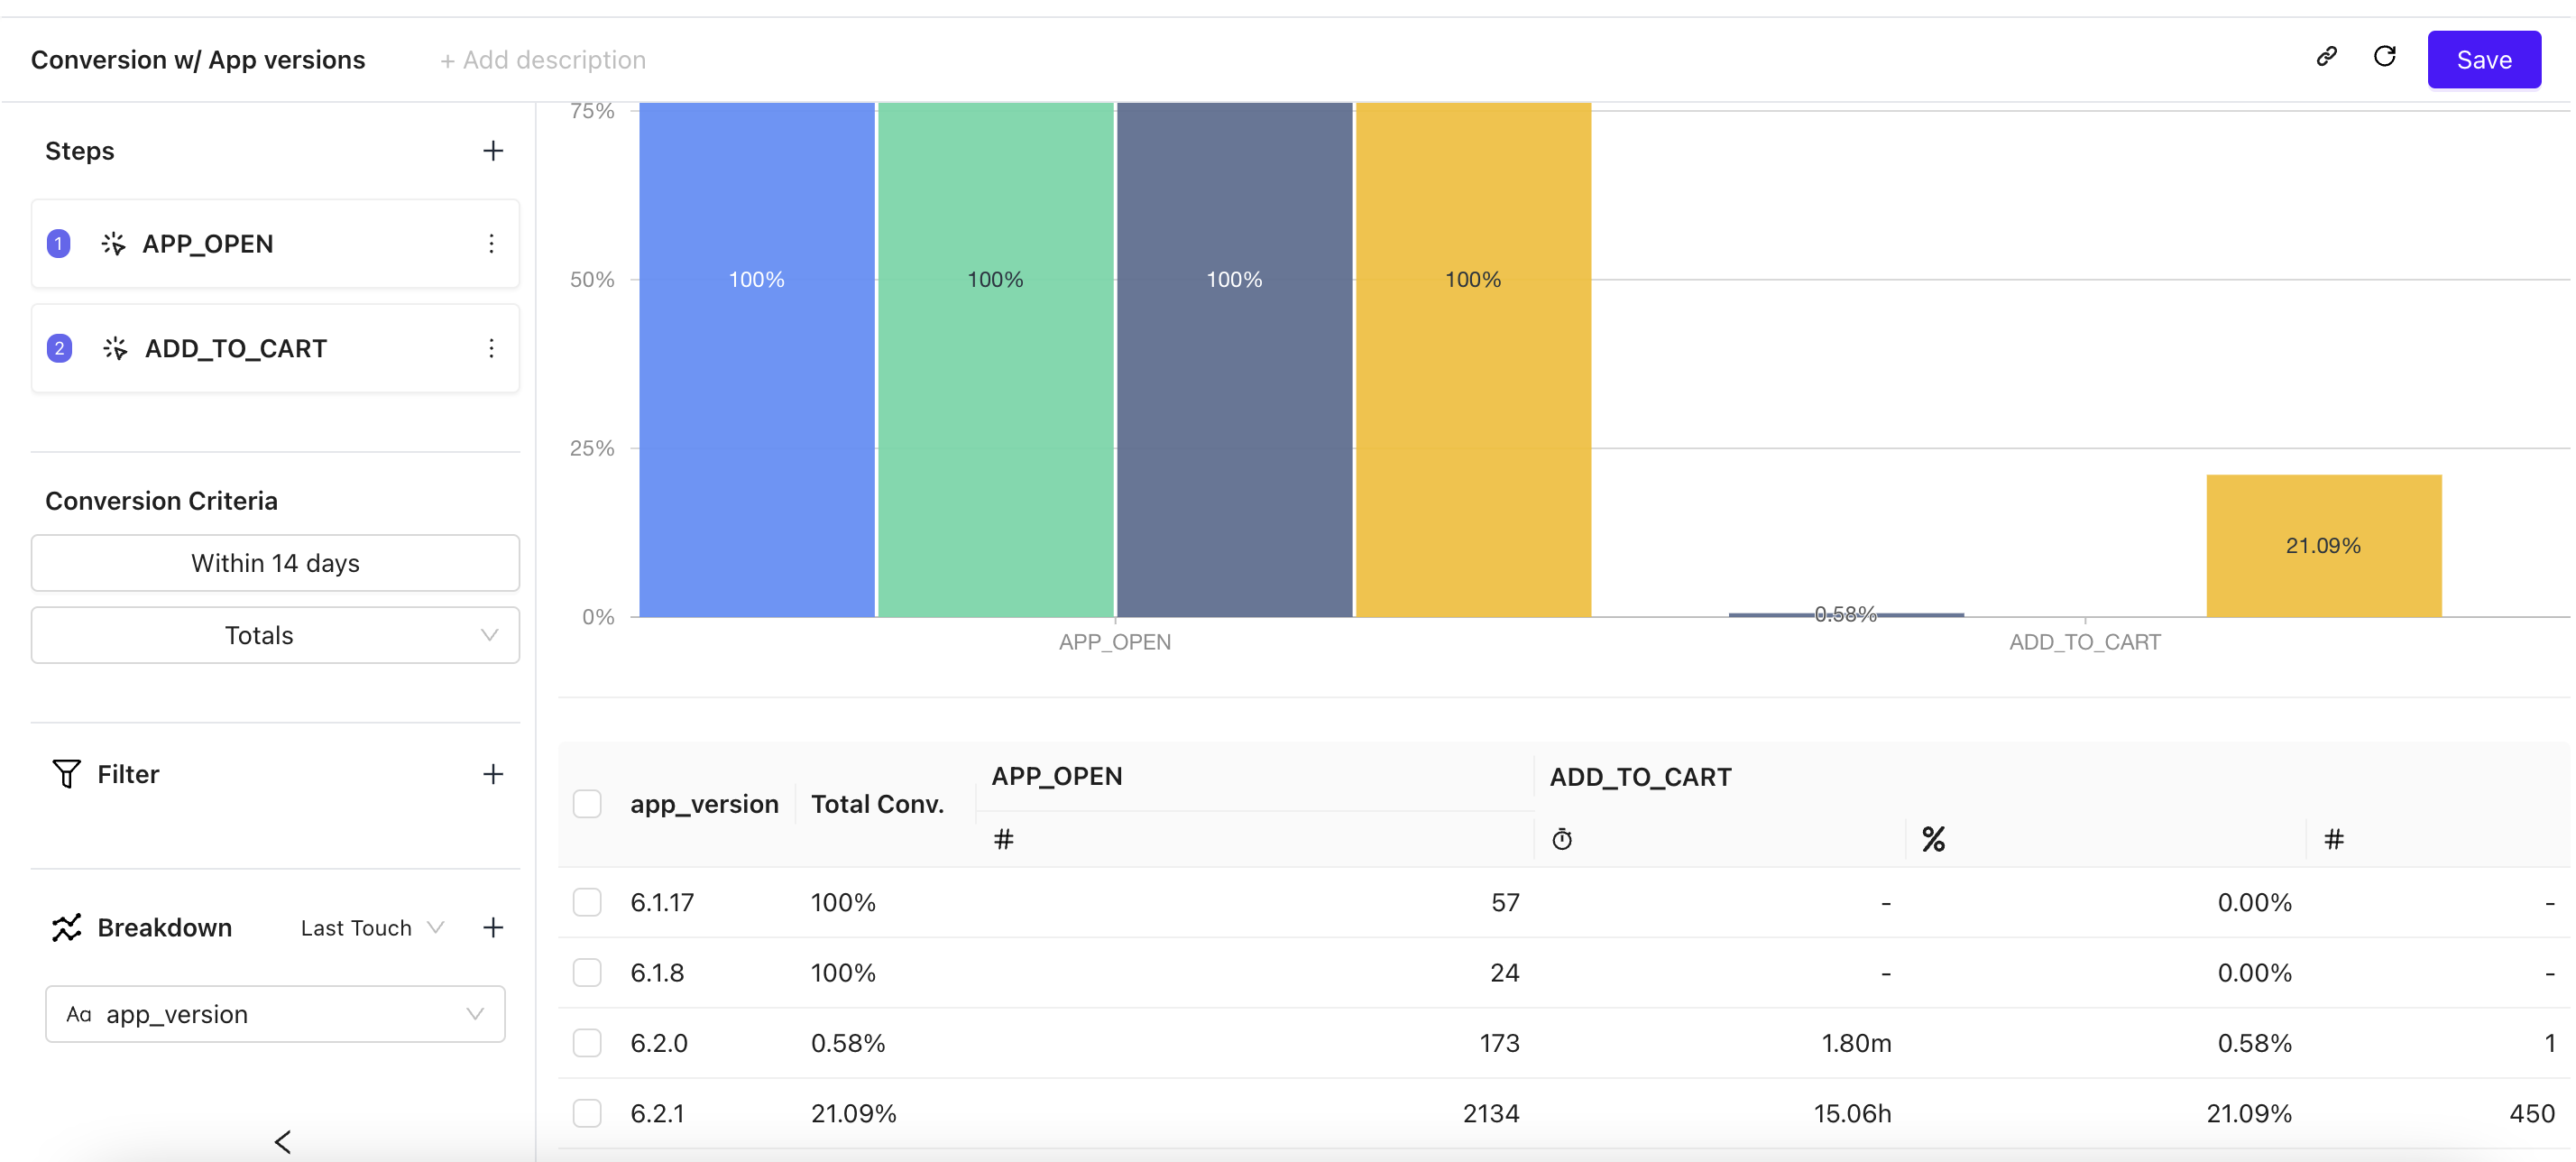
With drill-down on event properties PI can create funnel views based on different properties such as Device Type, Country, Region, City etc. Building deeper understanding into the usage demographics.
Comparing conversion rates over time
With PI, you can also compare the conversion funnels at different points of time. Week over Week, Month over Month comparisons allows our clients to track their platform’s growth and user engagement
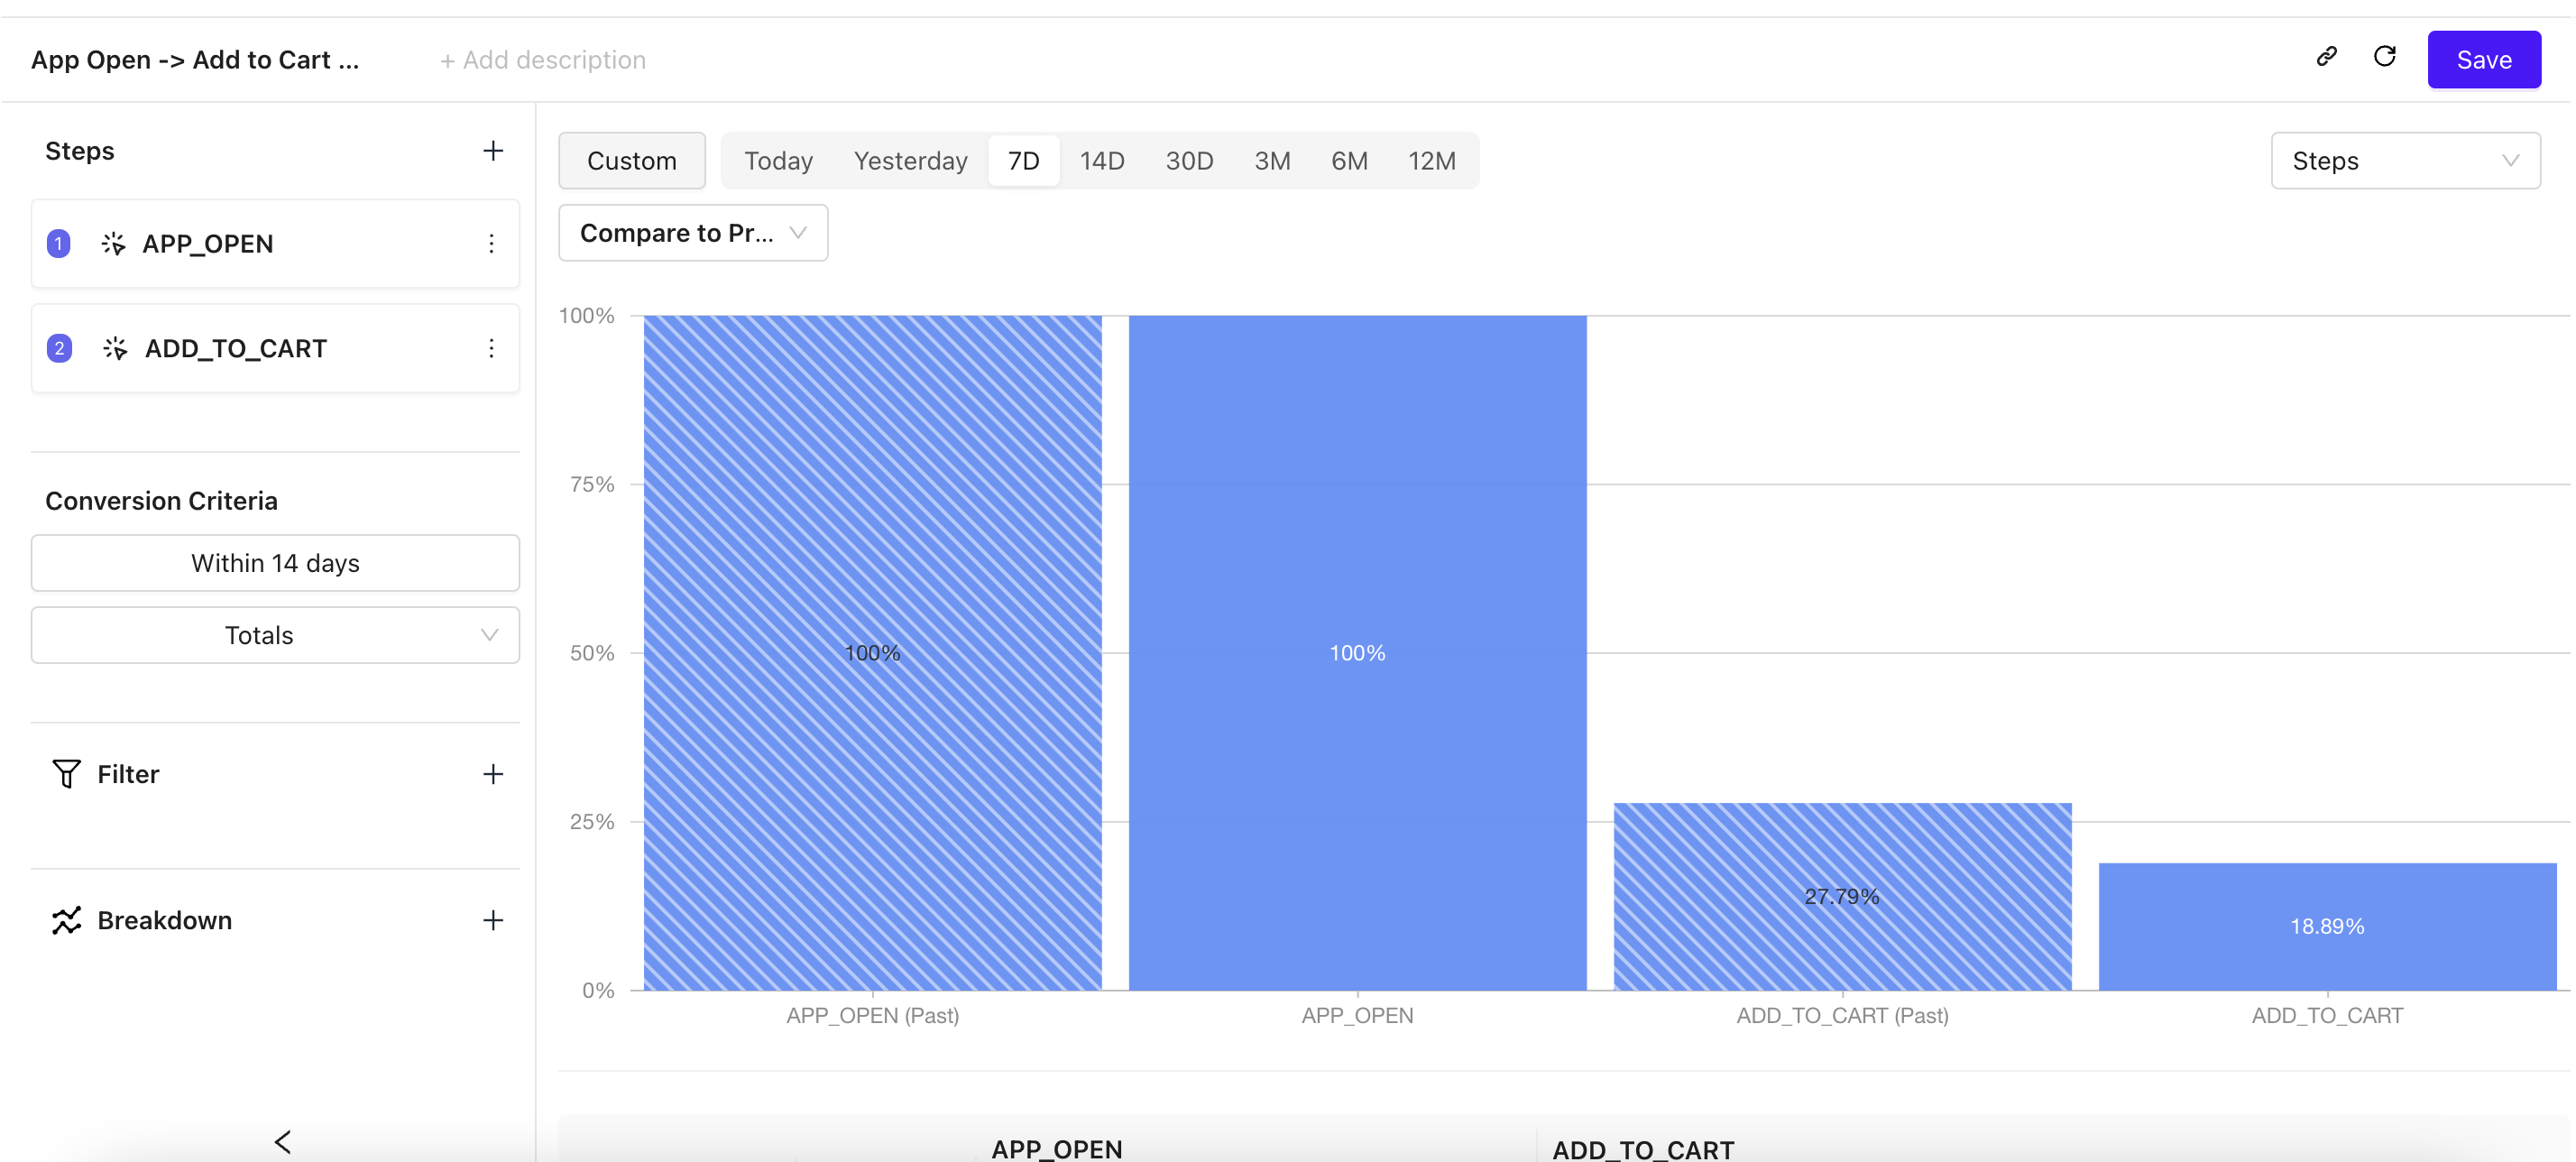
In this example, it is evident that compared to Past Week, the conversion % has dropped by nearly 9%.
Getting more from PI
Conversion funnels are only a small part of the information analytics puzzle. PI provides capability to track and measure repeating vs one-time buyers. With Live Cohorts of repeat/one-time buyers, PI can power more grounded and use-case driven story boards.
Follow us for continued updates
Our home page: Home
X (formally Twitter): @Percept_Insight
LinkedIn: LinkedIn Profile