Result analysis

After conducting an A/B experiment, the critical next step is to thoroughly analyze the outcomes to determine how each variant influenced user behavior and overall performance. The Result Analysis section in Percept Insight is designed to provide you with an in-depth understanding of your experiment's impact, offering a range of powerful tools and metrics that enable you to make informed, data-driven decisions.
This section allows you to assess various key metrics, compare the performance of different variants, and understand the statistical significance of your findings. By leveraging these insights, you can confidently identify which changes were effective, understand the extent of their impact, and decide on the best course of action for your product or service. Whether you're determining the winning variant to roll out broadly or iterating on your findings for further experimentation, Percept Insight equips you with everything you need to optimize your decision-making process.
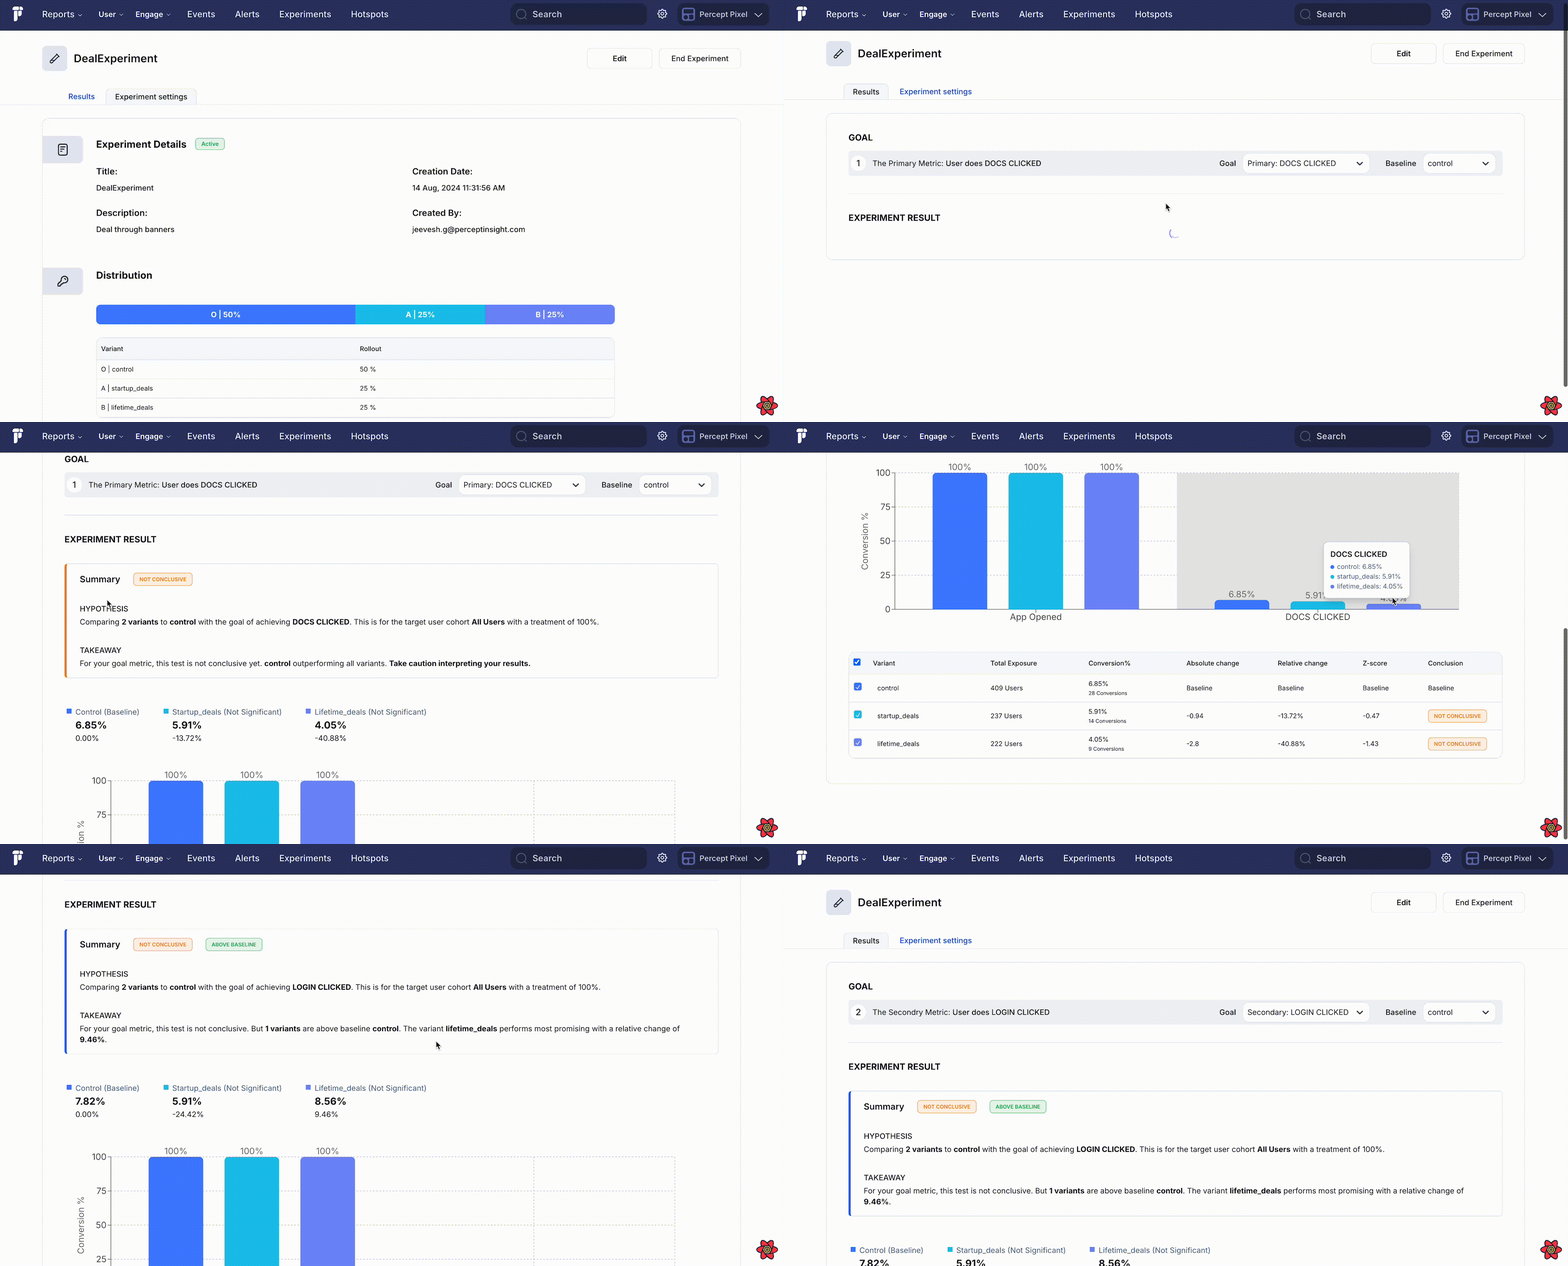
Navigating to the GOAL

-
Choose the Metric for Analysis:
- Start by selecting the metric you want to analyze. By default, the system will focus on your primary metric, but you can switch to any other metric relevant to your experiment.
-
Select the Baseline Variant:
- Next, choose the Baseline variant for comparison. By default, this will be the control variant, but you can select any variant as the Baseline if you want to compare against a different benchmark.
Analyzing Key Metric

-
Conversion Rate Comparison:
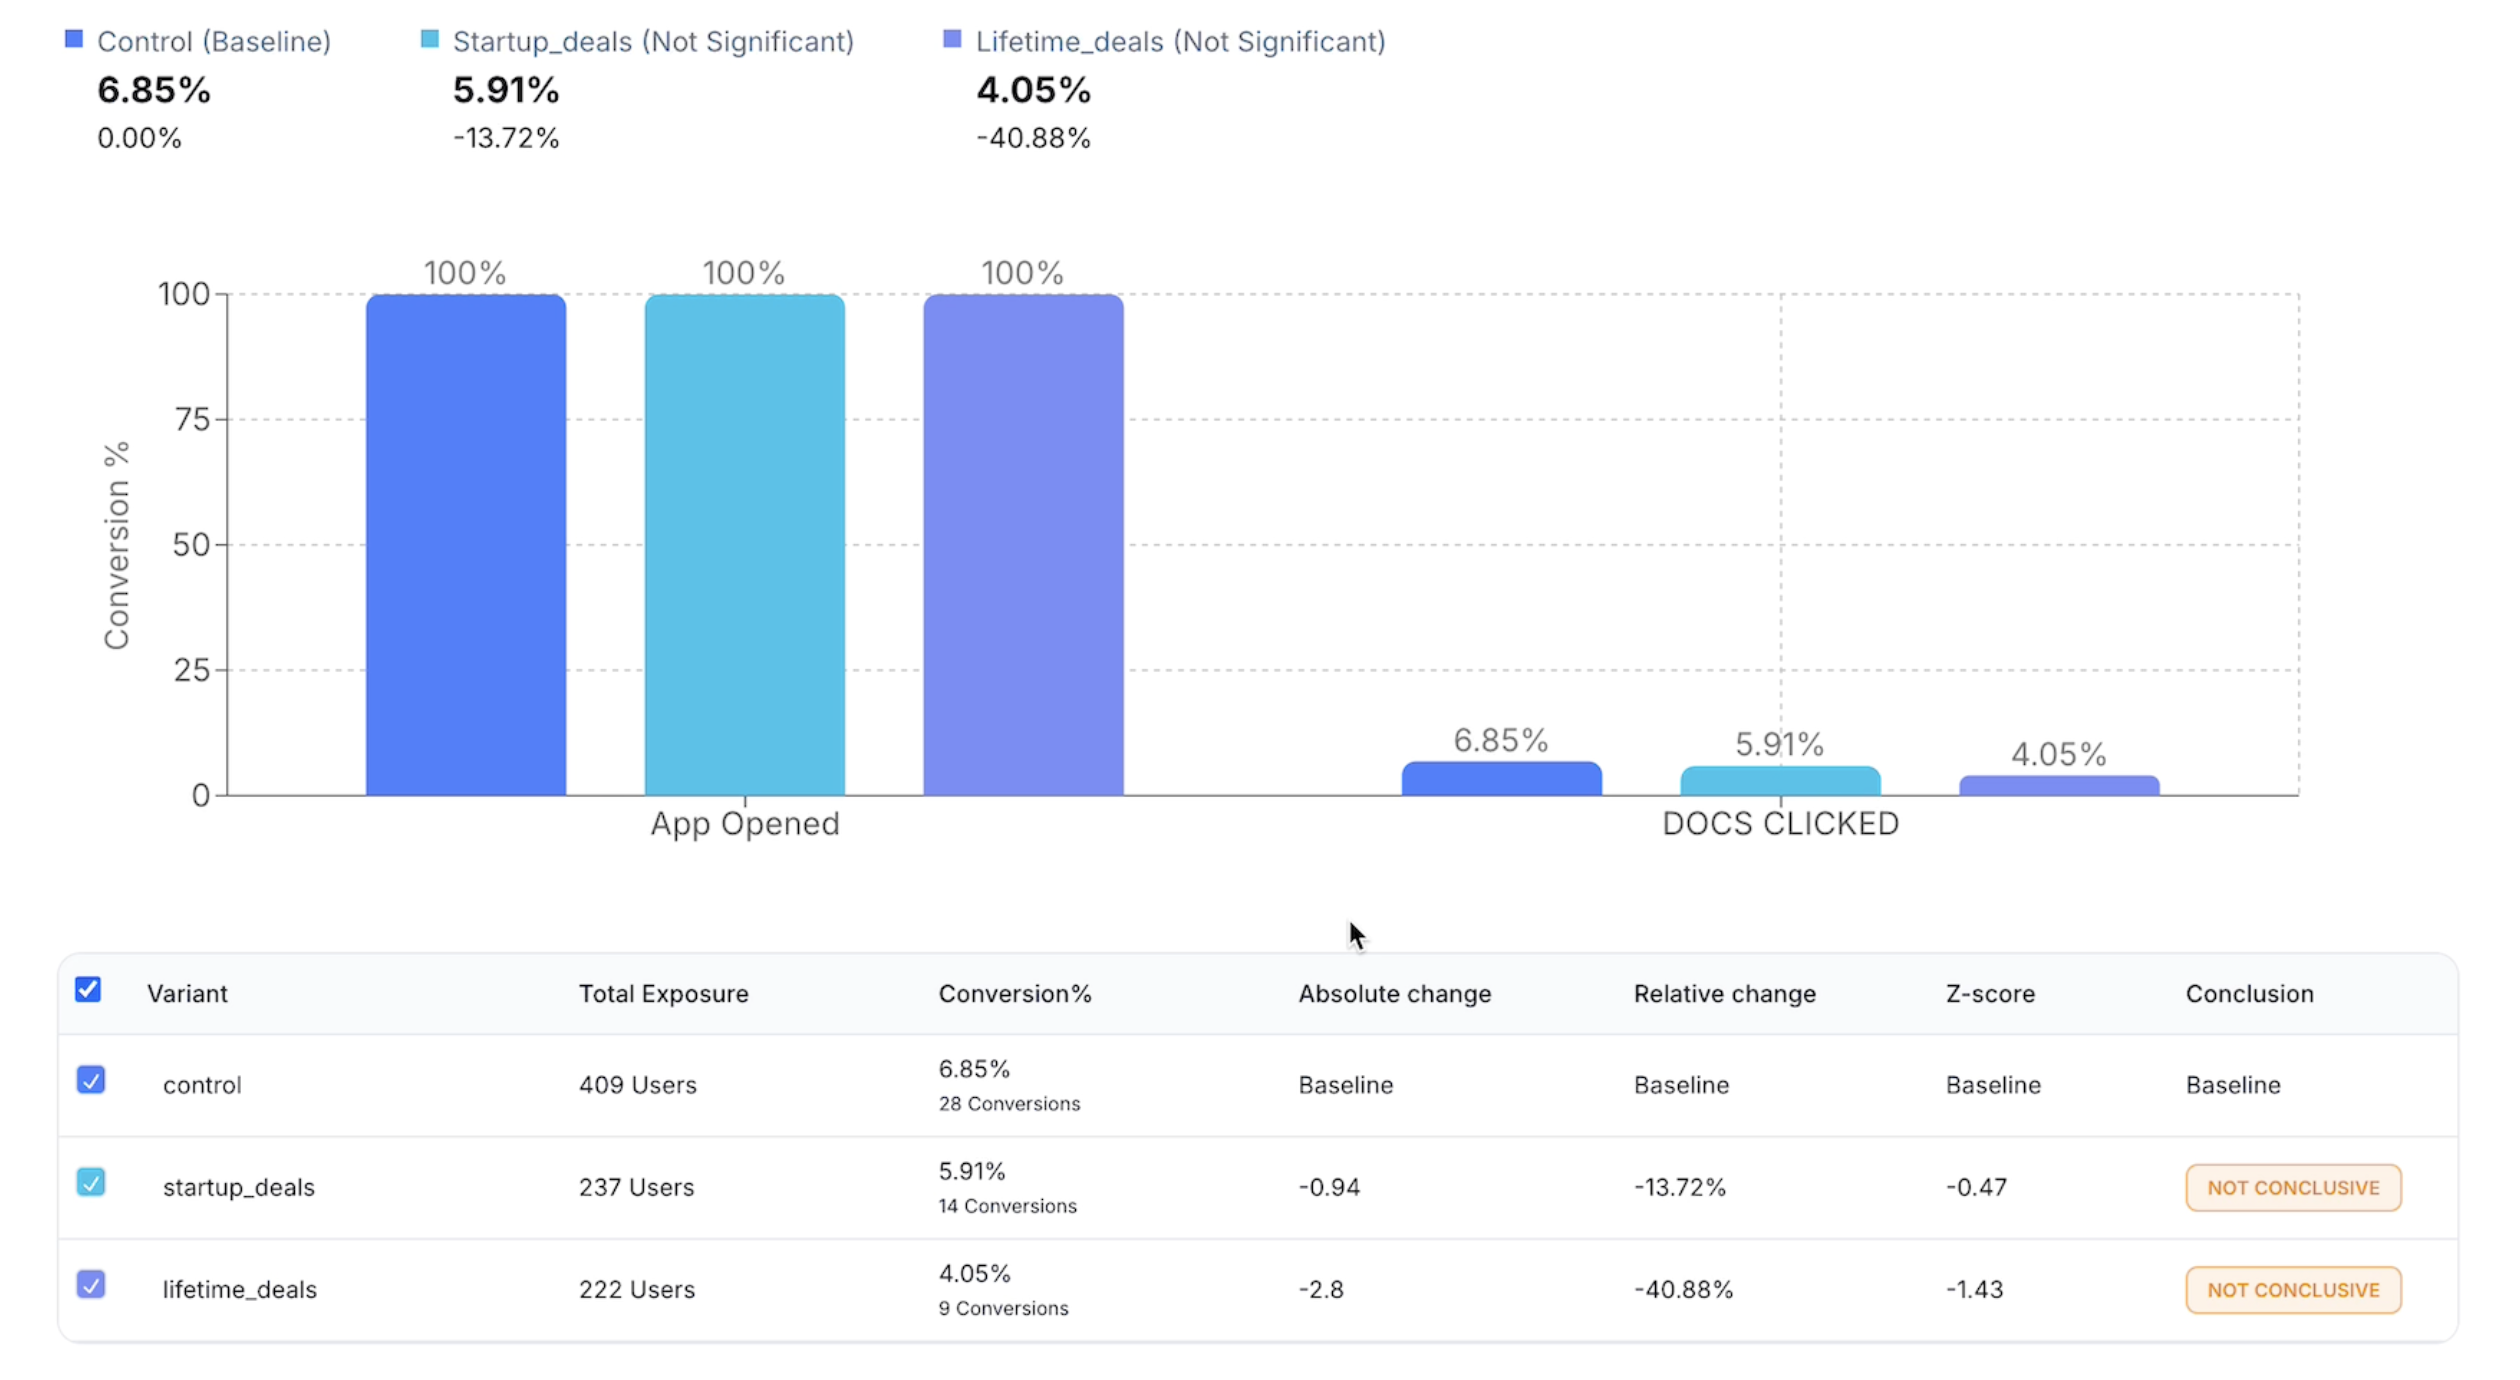
- Conversion Rate is one of the most critical metrics in A/B testing. It shows the percentage of users who completed a desired action (e.g., making a purchase, signing up) out of the total users exposed to a particular variant.
- In the dashboard, you'll see a side-by-side comparison of conversion rates for each variant and the control group. Look for significant differences to identify which variant performed better.
- Tip: A higher conversion rate in a variant suggests that the changes made in that version positively impacted user behavior.
-
Absolute Change:
- Absolute Change represents the direct difference in conversion rates between a variant and the Baseline (or control). This metric helps you see the straightforward impact of the changes made in the variant.
- In the results table, you’ll find the absolute change displayed for each variant relative to the Baseline.
- Example: If the control has a conversion rate of 10% and a variant has 12%, the absolute change is +2%. This means the variant improved conversion by 2 percentage points.
-
Relative Change:
- Relative Change is expressed as a percentage and shows how much the conversion rate of a variant has increased or decreased relative to the Baseline. This metric is essential for understanding the proportional impact of the changes.
- The relative change is calculated by comparing the variant's conversion rate to the Baseline's conversion rate, providing a more nuanced view of the experiment's impact.
- Example: If the control has a conversion rate of 10% and a variant has 12%, the relative change is +20%. This means the variant increased conversions by 20% relative to the control.
-
Statistical Significance:
- Percept Insight calculates statistical significance to help you determine whether the differences observed between variants are likely due to the changes made, rather than random chance.
- In the dashboard, you’ll see a significance score (often represented as a Z-score) next to each metric. A score above 95% (1.95) generally indicates that the results are statistically significant, meaning you can be confident in the outcome (conclusive).
- Note: Statistical significance is crucial for making informed decisions. If a variant shows a significant improvement, it's likely that the changes had a real impact.
Result Summary

The Result Summary section in Percept Insight provides a high-level overview of your A/B experiment results, focusing on the key outcomes and their implications. This section helps you quickly understand whether your experiment's findings are conclusive and what steps should be taken next.
-
Status Indicators
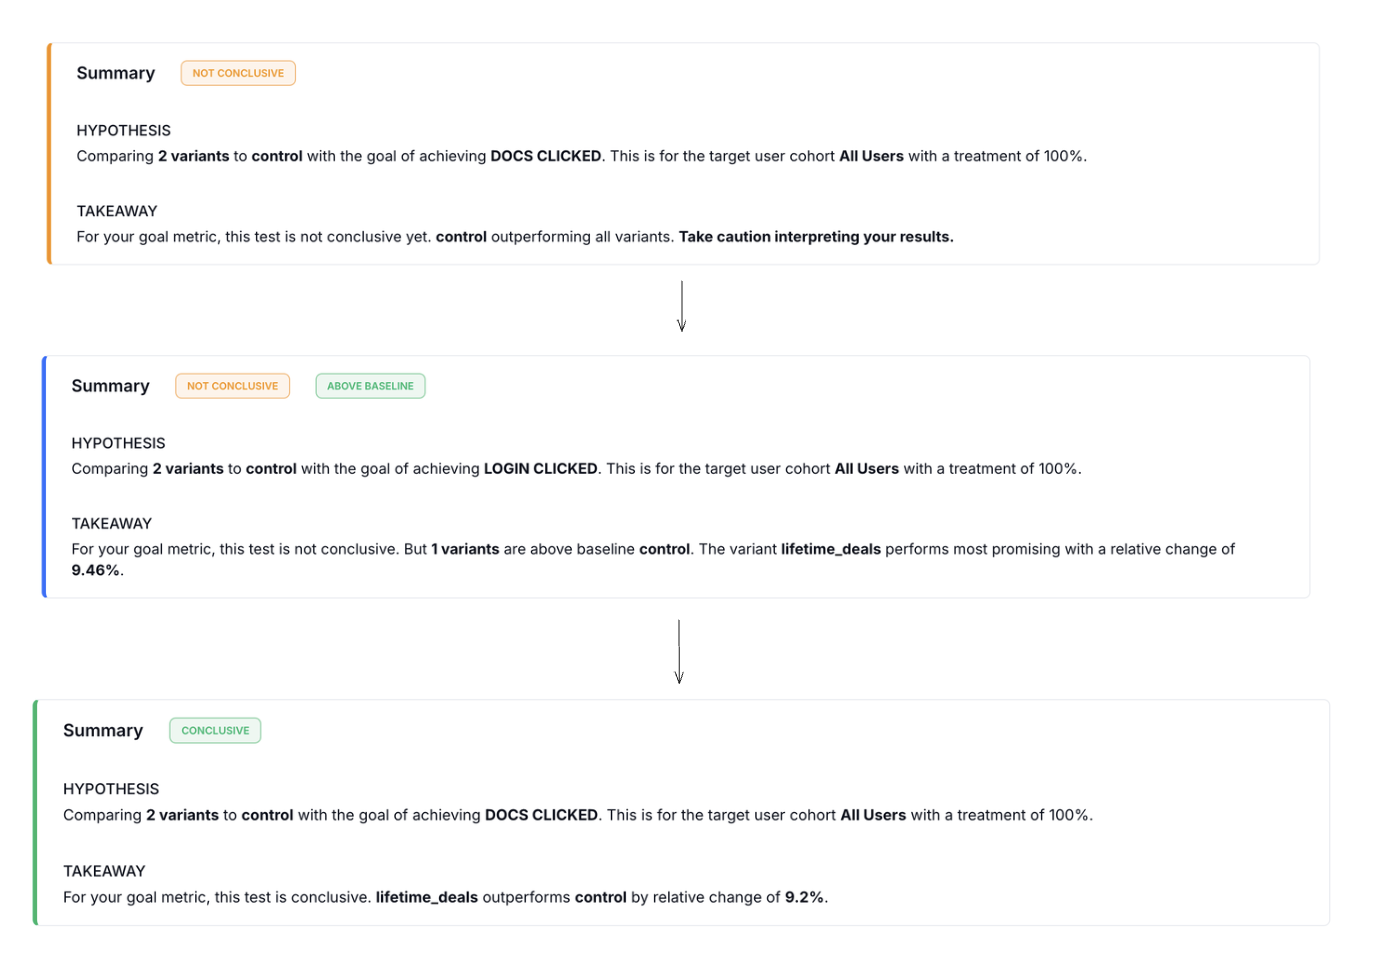
- NOT CONCLUSIVE: This tag indicates that the experiment's results are currently inconclusive, meaning that there is no statistically significant difference between the control and the variants. Further data collection may be needed to reach a conclusive result.
- ABOVE BASELINE: This tag is applied when at least one variant shows performance above the baseline (control), even if the results are not yet conclusive. It suggests potential positive effects that warrant further investigation.
- CONCLUSIVE: When this tag appears, it indicates that the experiment has reached a statistically significant conclusion. You can confidently determine which variant outperformed the others based on the goal metric.
-
Hypothesis
-
The hypothesis states the primary objective of the experiment, typically comparing multiple variants to a control group with the aim of achieving a specific goal metric. The target user cohort and the treatment percentage are also outlined here to clarify the experiment's scope.
-
Example: "Comparing 2 variants to control with the goal of achieving DOCS CLICKED. This is for the target user cohort All Users with a treatment of 100%."
-
-
Takeaway
-
This section distills the results of the experiment into actionable insights. Depending on the experiment's outcome, the takeaway will guide you on whether the results are conclusive, which variant performed best, and any relative or absolute changes observed.
- If the results are not conclusive, this section may advise caution in interpreting the data or suggest further testing.
- For conclusive results, it highlights the most promising variant and quantifies its performance relative to the control.
-
Example Takeaway for Conclusive Result: "For your goal metric, this test is conclusive.
lifetime_dealsoutperformscontrolby a relative change of 9.2%."
-