Heatmaps
What is the Heatmaps Feature?
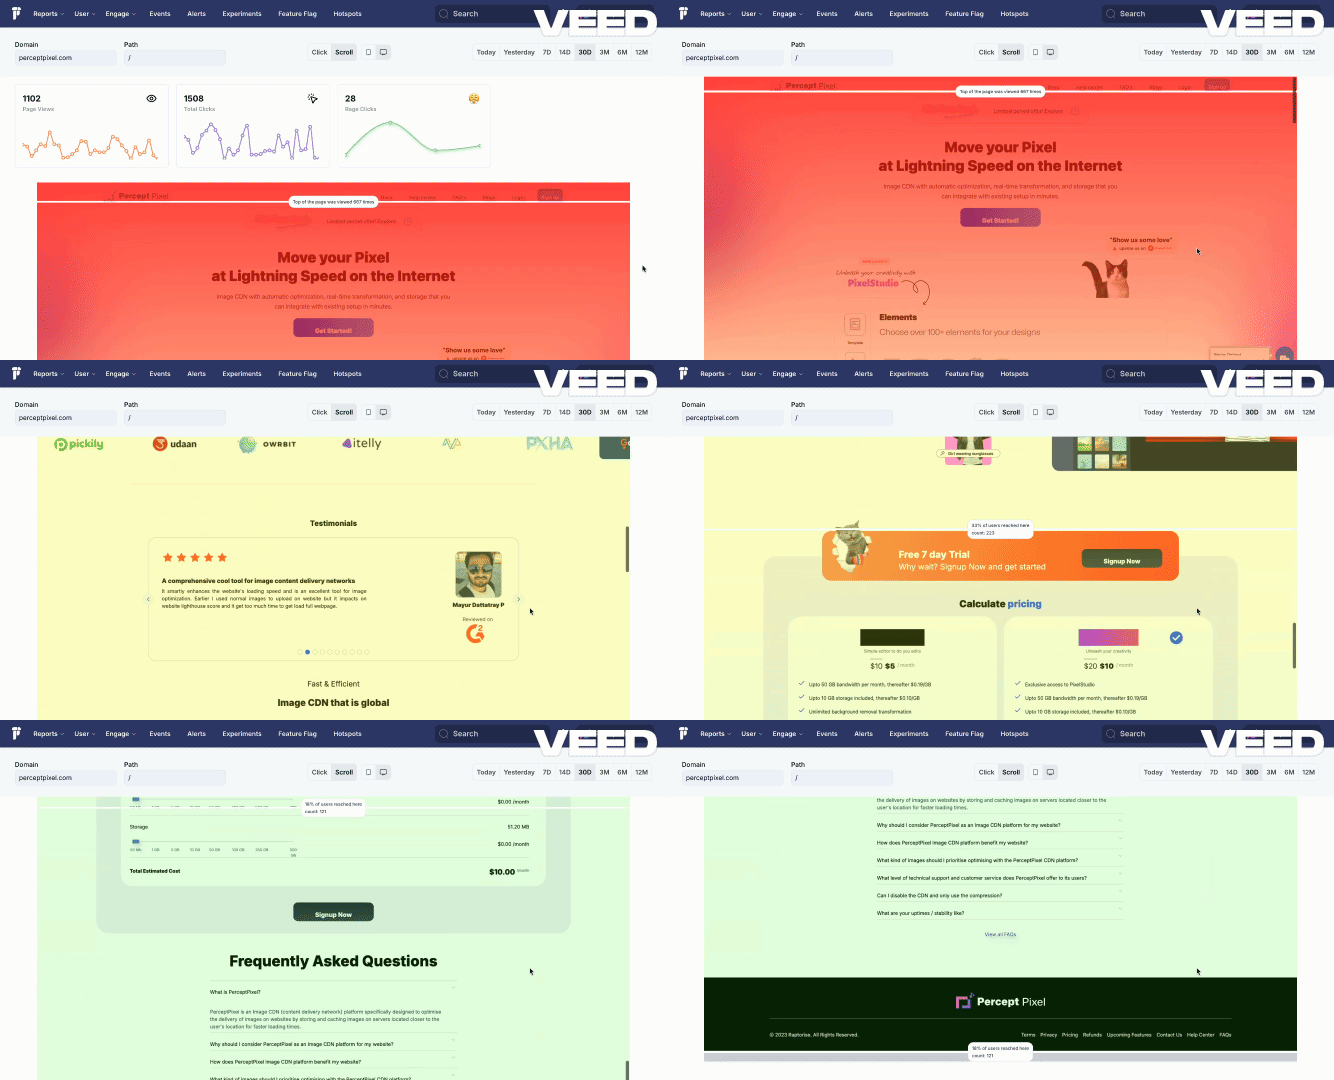
The Heatmaps feature provides invaluable insights into user scroll behavior on websites and applications. By showing where users scroll and where they drop off, businesses can gain a clearer understanding of how far users engage with content on each page. This feature helps in pinpointing the exact sections of a page where users lose interest, allowing for better optimization and improved user experiences.
Key Functionalities:
1. Visualizing Scroll Depth:

Heatmaps divide a webpage into different segments, each representing a scroll depth that users have reached. These visual indicators highlight areas where users tend to stop or drop off.
- Sections with higher engagement (more scrolls) are visually represented, showing where users are most engaged.
- Segments near the end of a page may indicate fewer users, pointing out where interest declines.
Businesses can easily recognize how far down the page users typically go, which can help optimize the placement of key content such as:
- Call-to-action buttons (e.g., "Sign Up" or "Learn More")
- Important information (e.g., product features or testimonials)
- Interactive elements (e.g., forms, quizzes, or videos)
2. Scroll Engagement Metrics:
For every page, the Heatmaps feature provides critical metrics such as:
Scroll Depth Segments:

- Scroll segments visually indicate where users drop off while scrolling through a page.
- Businesses can analyze each segment to see where the most significant drop-offs occur, allowing them to understand how effectively users are engaging with their content.
User Drop-off Points:
- These metrics highlight the exact sections of a page where users stop scrolling, offering businesses a clear picture of content that may need restructuring or repositioning.
- Example: If a large number of users drop off before reaching the call-to-action section, businesses may want to move it higher on the page.
3. Time Range Customization:

Like Hotspots, the Heatmaps feature allows for time-based filtering. Users can select specific time ranges to analyze scroll data, helping them evaluate content performance and engagement over time.
- Businesses can track the success of marketing campaigns, redesigns, or content updates by comparing engagement metrics across different time periods.
4. Path Selector:

The Path Selector allows businesses to drill down into specific pages or URLs to analyze user scroll behavior for individual sections of their site or app.
- For example, they can evaluate the scroll depth on:
- Landing pages: Are users scrolling far enough to engage with key content?
- Product pages: Are users exploring the full product details, or are they dropping off early?
By focusing on individual paths, businesses can fine-tune content and page layout to maximize user engagement.
In-Depth Analysis & Use Cases:
Identifying Content Drop-off Points:
- The Heatmaps feature reveals the sections of a page where users are most likely to drop off.
- Businesses can identify underperforming sections, understand why users may lose interest, and adjust their content to keep visitors engaged for longer periods.
Optimizing Content Placement:
- If key information, such as call-to-action buttons or important details, is located in sections with low engagement, businesses can consider repositioning these elements higher up the page to capture user attention earlier.
- Example: If users consistently drop off before a critical message is seen, moving that message up can improve conversions.
Improving Page Layout for Maximum Engagement:
- By analyzing scroll patterns, businesses can restructure their page layouts to ensure that users are naturally guided towards high-value sections, such as purchase buttons or subscription forms.
- A/B Testing: Heatmaps are ideal for A/B testing different page designs and layouts to identify which version retains user attention better.
Understanding User Flow:
- The Heatmaps feature provides insight into how users interact with a page from top to bottom, revealing which sections are most engaging and which are often ignored.
- This allows businesses to make data-driven decisions to improve user flow and overall engagement.
Enhancing Mobile User Experience:

- With multi-device support, businesses can see how users scroll across desktop, mobile, and tablet devices.
- This is crucial for ensuring that mobile experiences are as seamless and engaging as desktop experiences, particularly for longer pages where scroll behavior may differ significantly.
Why Heatmaps are Essential for Businesses:
The Heatmaps feature is a powerful tool for any business aiming to improve content engagement and user experience. By providing detailed insights into how far users scroll and where they drop off, businesses can make informed decisions to better structure their pages, retain user interest, and optimize content placement.
Key benefits include:
- Data-driven content optimization: Heatmaps offer real-time data that businesses can use to refine content layout and increase user engagement.
- Better user retention: Identifying and addressing content drop-off points helps businesses keep users on the page longer, reducing bounce rates.
- Enhanced user experience: With insights into scroll behavior, businesses can create more intuitive, engaging layouts that align with user expectations.
In short, the Heatmaps feature provides critical visibility into user interaction, allowing businesses to continuously optimize their digital presence for maximum impact.