Flow
The “Flows” feature on Percept Insight provides a comprehensive analysis of how users interact with your product or website. By visualizing the paths users follow from one interaction to the next, Flows offer invaluable insights into user behavior. These insights can inform product development and optimization, allowing businesses to make strategic decisions that improve usability and overall user satisfaction. In this document, we will explore the importance of this feature, discuss an example based on the screenshot, and provide conclusions regarding how businesses can leverage Flows to enhance user experience.

What is the Importance of the Flows Feature?
Understanding user navigation is critical for optimizing a product's success. The Flows feature helps businesses answer essential questions like:
-
Where do users go after taking a specific action?
This feature tracks user paths from one screen to another, identifying whether they navigate as expected or veer off course.
-
What roadblocks or friction points exist?
Flows highlight where users drop off, lose interest, or get stuck, helping identify potential obstacles in the user journey.
-
How can engagement be improved?
By analyzing how users interact with various features, businesses can streamline navigation, make informed design changes, and guide users more effectively toward desired outcomes (such as purchases or completing a task).
In essence, Flows help businesses identify patterns and trends in user behavior, enabling them to enhance product usability, reduce friction, and increase engagement.
Example and Steps of Flows in Action
- Go to Reports
- Click on Flows
- Click on the Plus (+) to add steps (Event)
- Once the event is selected, choose the steps (e.g., 1, 2, 3, or more) to analyze user interaction.

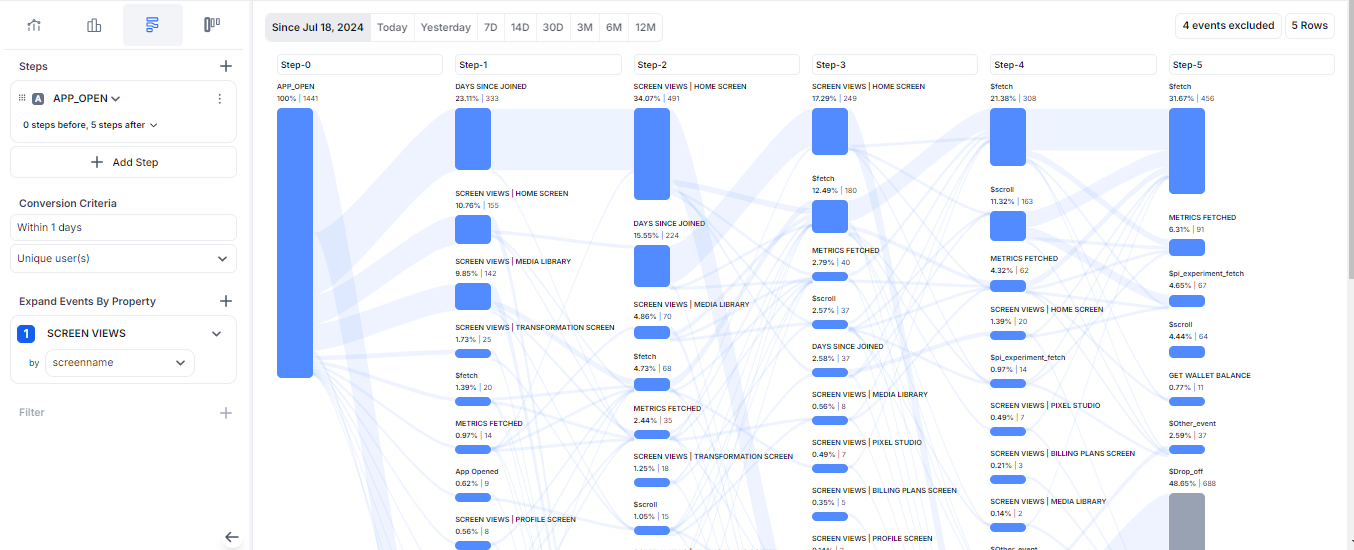
Let's consider the screenshot of a flow visualization for the "App_Open" event:
-
Step 0: APP_OPEN (100% of users)
This is where users start, with 1441 users opening the app.
-
Step 1: Days Since Joined
From here, 23.11% of users (333 users) proceed to this category, showing how recently users joined after opening the app. Meanwhile, 10.76% of users (155) go directly to the Home Screen under Screen Views, a core navigation point.
-
Step 2: Screen Views and Actions
A significant number of users then interact with the Home Screen (34.07% of users or 491). Others interact with the Media Library (9.85%) and Transformation Screen (1.73%), highlighting the primary areas where users engage next after opening the app.
-
Step 3 to Step 5: Deepening Engagement
The flow continues showing how users perform different actions such as fetching data (21.38% of users or 308) or scrolling (11.32%). These interactions show how users engage with the product after the initial steps. By tracking these actions, you can better understand user behavior, allowing you to make targeted improvements to the user journey.
Drop-offs and Metrics
At each step, some users drop off, which can be crucial in identifying areas of improvement. For example, after interacting with the Home Screen in Step 2, only 12.49% continue to the next step, indicating potential friction or drop-offs in this area. Understanding where users abandon the flow can help companies make design adjustments to reduce churn.
Additional Options for Flow Events
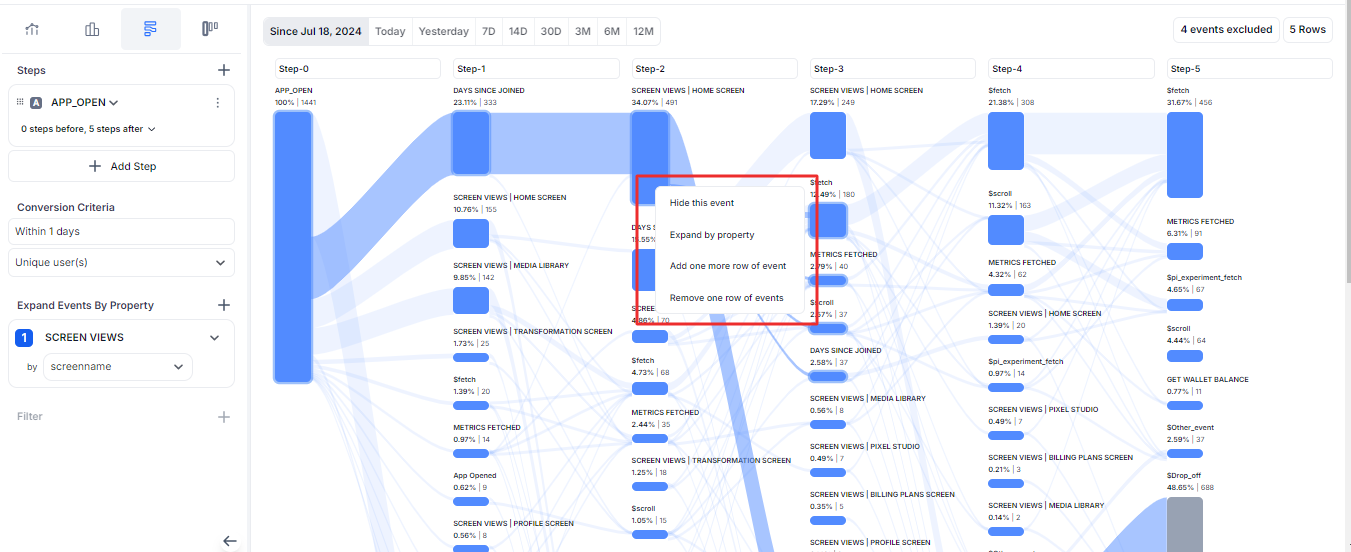
At each step within the flow, there are four right-click options that allow for deeper customization and refinement of the user journey analysis:

-
Hide this event
This option allows you to remove a specific event from the flow. This can be particularly useful when certain events aren't relevant to your analysis, helping you focus only on the most critical actions users take. Hiding events can declutter the flow and allow for a more focused view of the primary actions in the user journey.
-
Expand by property
Expanding an event by property lets you drill down into more granular details associated with that event. For example, you can segment the event by user properties such as location, device type, or user group. This enables more detailed analysis of how different user segments interact with your product, offering insights into specific behaviors or preferences.
-
Add one more row of event
This feature allows you to extend the flow by adding an additional row of events, giving you a more comprehensive view of the user journey. You can analyze more steps users take after the current flow, which is helpful for tracking long or complex user interactions, ensuring no part of the user journey is left out.
-
Remove one row of events
If the flow becomes too complex or if additional events clutter the visualization, this option helps simplify the analysis by removing one row of events. This is useful for narrowing down the view to focus on the most significant steps and minimizing distractions from less relevant events.
Key Takeaways:
- Data fetching and scrolling are significant actions at later stages of the flow.
- Drop-offs occur at each stage, but identifying the precise points where users disengage (such as after a specific screen view) provides actionable insights.
- Businesses can use this flow to rework the user experience, reduce drop-off rates, and increase retention.
Analysis of Friction Points
Another essential aspect of Flows is identifying friction points where users abandon the process. The visualization helps pinpoint specific screens or actions where users encounter difficulties. In the provided flow, noticeable drop-offs occur after Step 3, where only 12.49% of users continue from the Home Screen. Similarly, by Step 5, only 31.67% of users are fetching data, while the rest may have dropped off or not performed any more significant actions.
Key Insights:
- Users abandon navigation after multiple screens — this could indicate frustration, confusing layouts, or uninteresting content.
- Metric fetching and scrolling are common follow-up actions, suggesting that users are looking for more information. Streamlining these processes may help reduce drop-offs.
Conclusion
The Flows feature on Percept Insight is an indispensable tool for businesses looking to improve the user experience by gaining insights into user behavior. By providing a detailed visualization of how users navigate through different steps, Flows allow companies to identify critical areas for improvement. In the example provided, it is clear that while many users engage with key screens like the Home Screen and Media Library, there are still areas where drop-offs occur, indicating opportunities for further optimization.
By leveraging this data, companies can:
- Enhance user journey mapping to improve navigation,
- Pinpoint areas of user friction to streamline processes, and
- Create more engaging experiences that encourage users to complete desired actions.
Ultimately, the ability to visualize and analyze user paths helps businesses increase user satisfaction and retention.
Best Practices for Using the Flows Feature
-
Regular Monitoring
Consistently review flow paths to identify shifts in user behavior over time. Regularly tracking trends allows businesses to spot emerging issues before they become significant pain points.
-
Testing Variations
Use the insights from Flows to A/B test different user journeys, identifying which paths lead to higher conversion rates or more extended user engagement.
-
Actionable Reporting
Use the data gathered from Flows to create actionable reports for your product teams. Highlight key drop-off points, suggest design improvements, and test new features to enhance navigation.
By incorporating these best practices, you can ensure that the Flows feature not only provides insights but also drives actionable change in your product's user experience.