Hotspots
What is the Hotspot Feature?
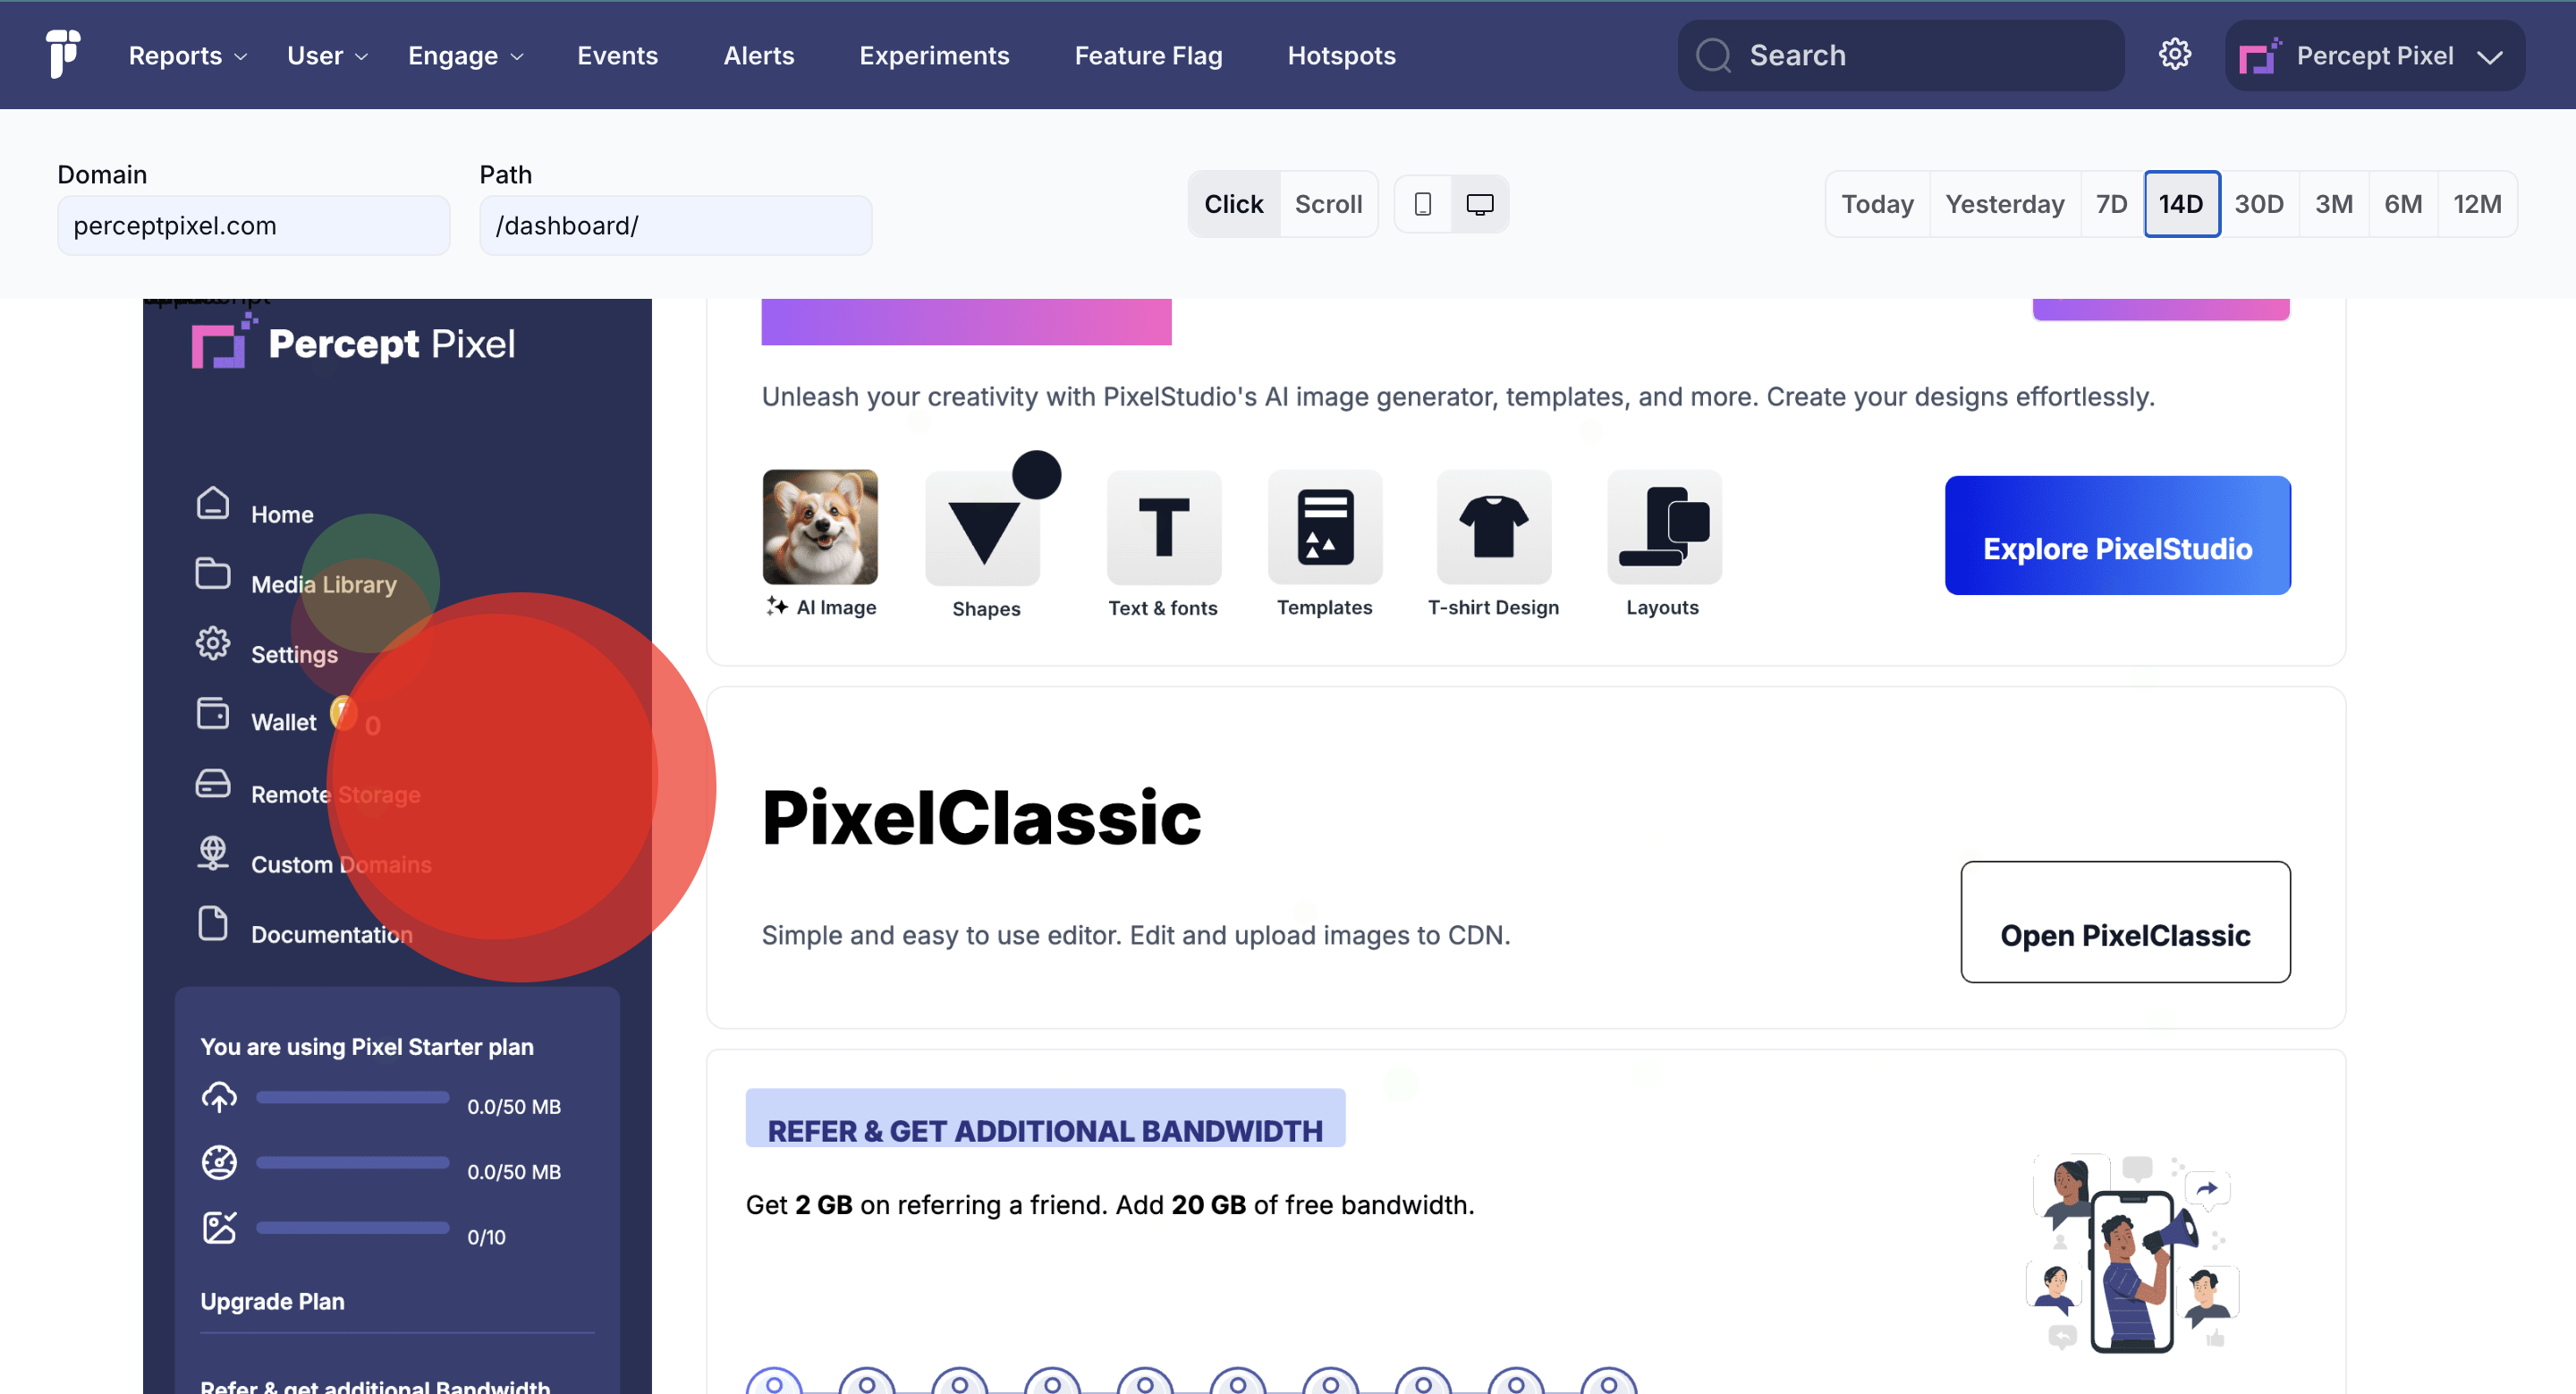
The Hotspots feature provides powerful visual insights into user interactions on websites or applications. By identifying areas where users most frequently click, businesses can gain a deeper understanding of user behavior, optimize key interface elements, and enhance overall user experience. This feature allows businesses to monitor click activity across different devices and paths (pages) while providing critical engagement metrics over customizable time ranges.
Key Functionalities:
1. Visualizing User Interaction with Hotspots:

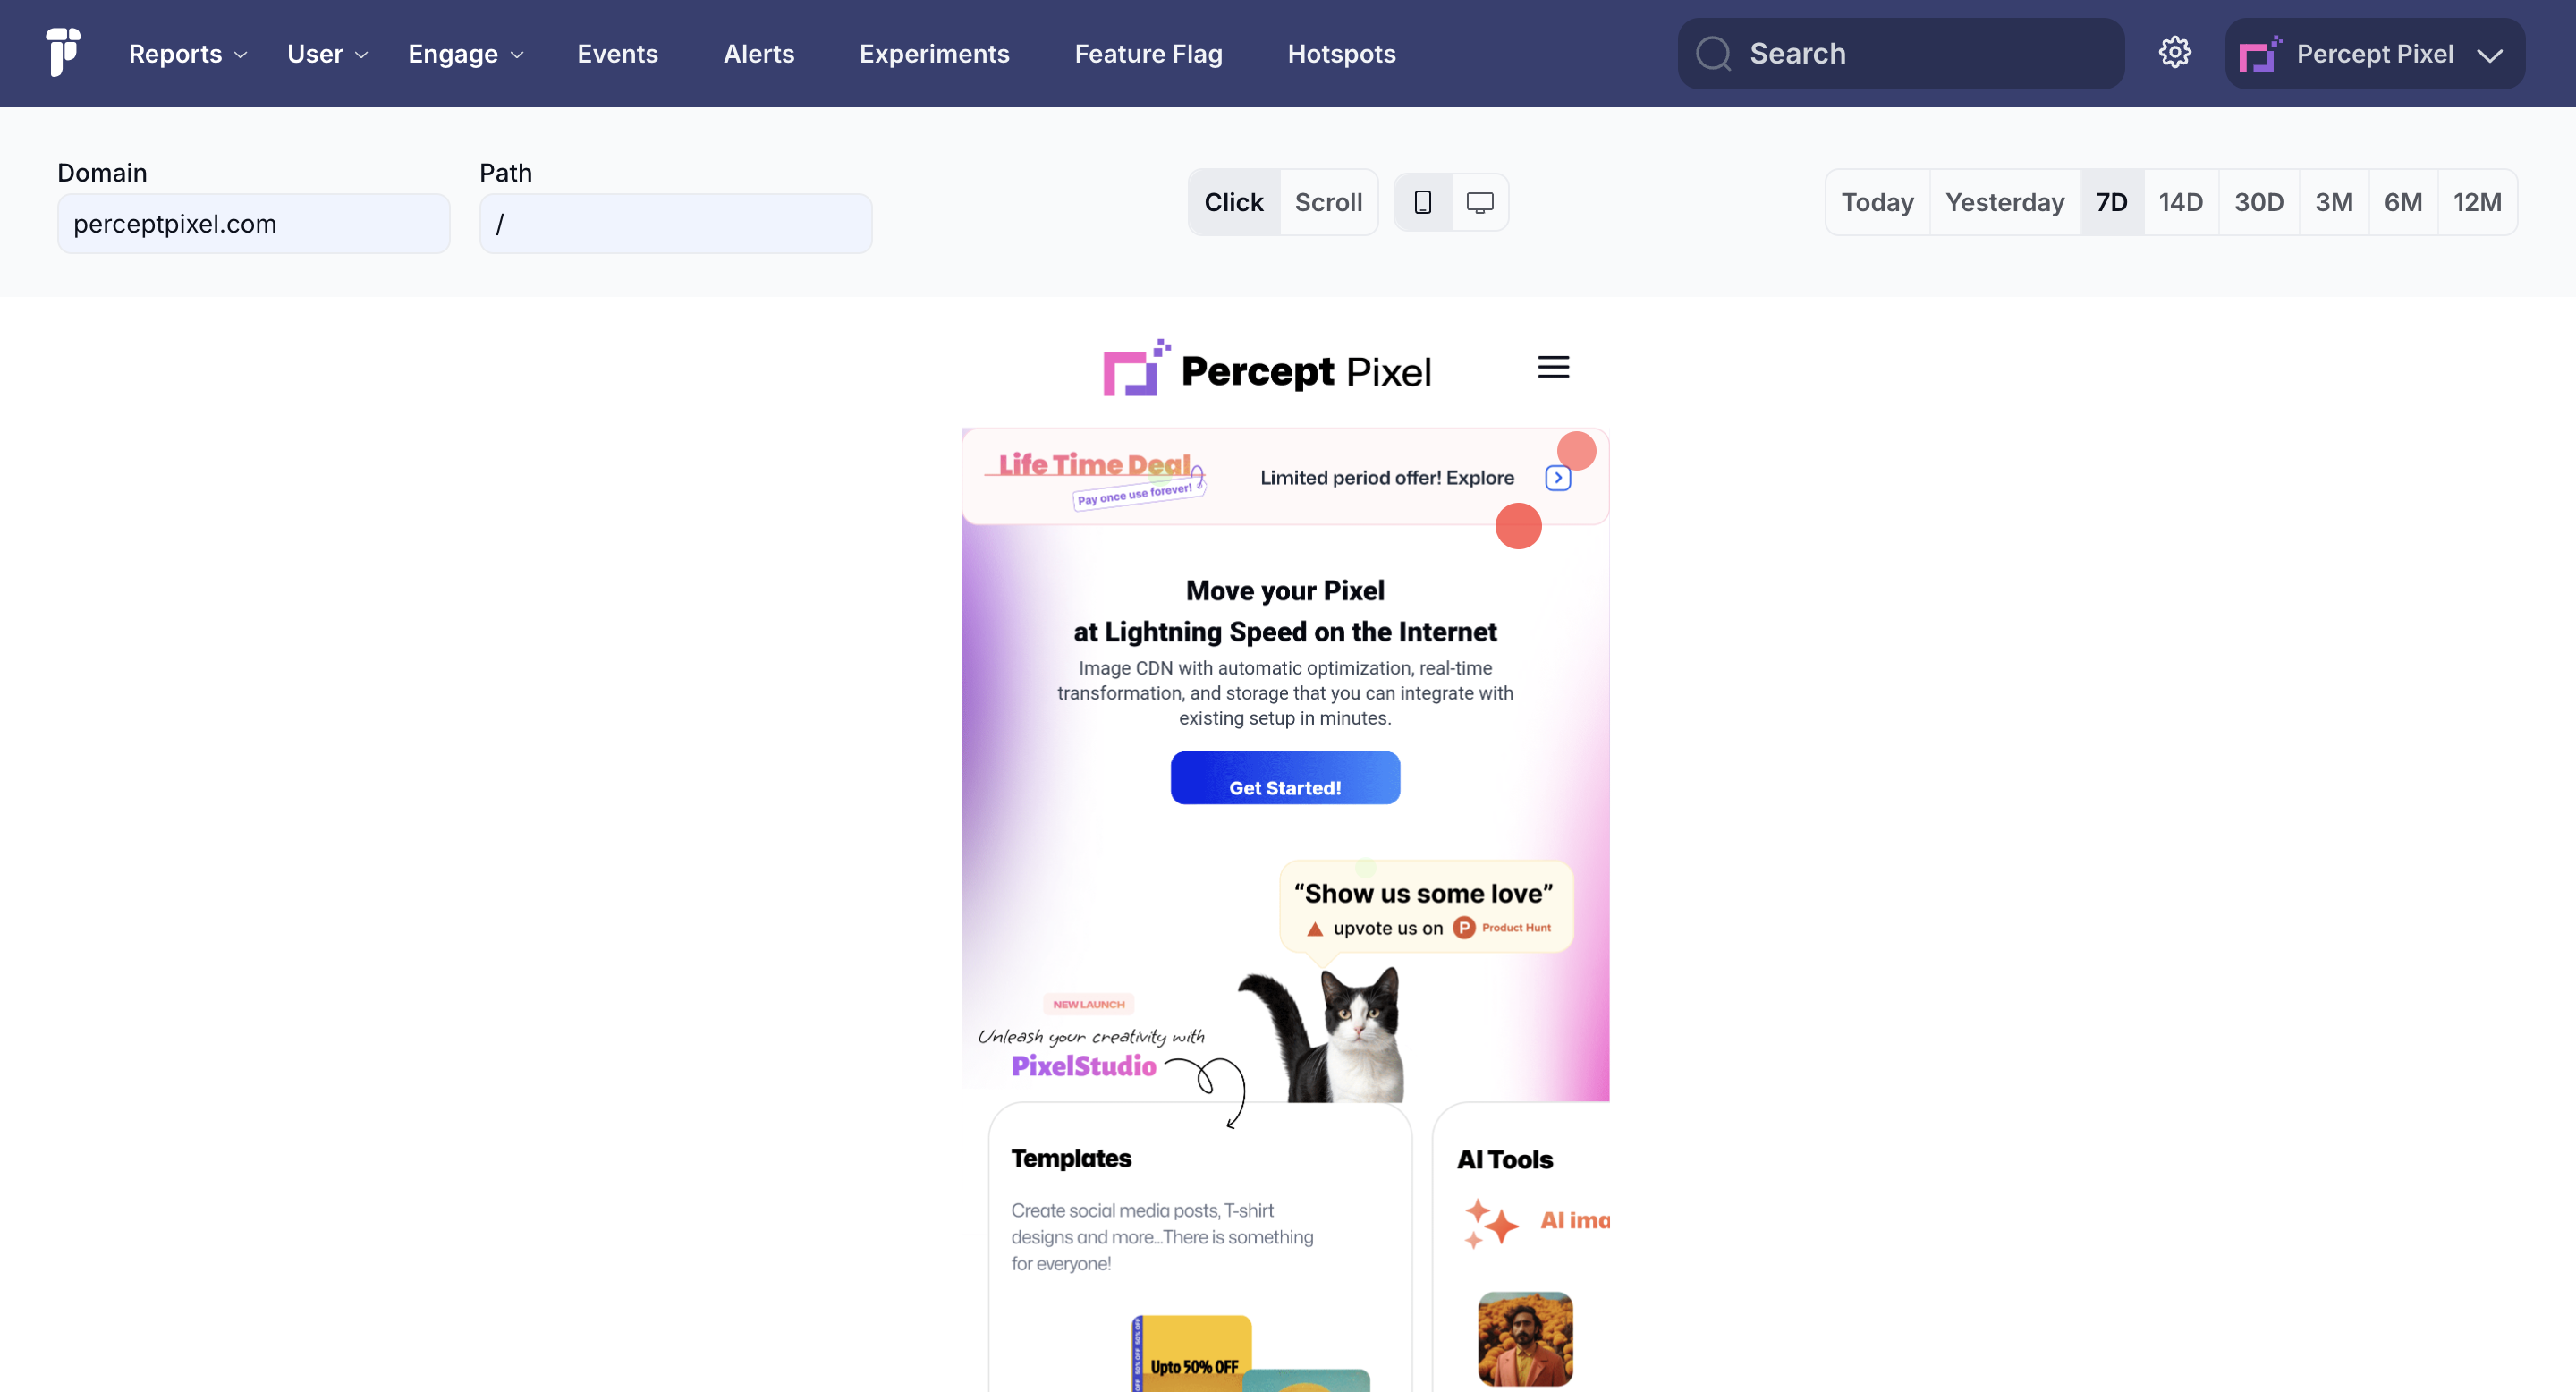
The Hotspots feature overlays visual indicators on specific areas of a webpage where users frequently interact. These visual markers—typically red circles—highlight sections that receive the most engagement. Larger and more intense circles signal areas with higher interaction frequency, while smaller circles indicate less active areas. This allows businesses to instantly recognize how well different parts of the page are performing. High-engagement areas might include: Call-to-action buttons (e.g., "Buy Now" or "Subscribe") Navigation links (e.g., menu items or category links) Interactive elements (e.g., forms, search bars, or product images)
2. Insightful Engagement Metrics: For each page, the Hotspots feature provides three core metrics:

Total Page Views:
This represents the number of times users visit a particular page, offering insight into the popularity of various paths. Pages with higher views likely play a critical role in the user journey, while low view counts may suggest the need for improved visibility or promotion.
Total Clicks:
This metric captures the total number of clicks on a given page, reflecting user engagement with interactive elements. A low number of clicks may indicate ineffective page design or call-to-action placement, prompting businesses to rethink their layouts or messaging.
Rage Clicks:
Rage clicks occur when users repeatedly click on an area in frustration, signaling that an element may be malfunctioning, unresponsive, or unintuitive. This metric highlights usability issues, enabling businesses to quickly address and resolve pain points that hinder user experience.
3. Time Range Customization:

The time range selector allows businesses to view click and engagement data over specific periods, providing flexibility for short-term and long-term analysis. Businesses can evaluate the impact of marketing campaigns or design changes by comparing engagement metrics before and after key events. Time-based filtering also helps identify patterns, trends, or seasonal shifts in user interaction, enabling data-driven decision-making for product or service optimization.
4. Path Selector:

The path selector feature allows businesses to drill down into specific pages or URLs, enabling focused analysis of individual sections of their website or app. For example, they can analyze the performance of: Landing pages: Are users engaging with critical information, or are they getting distracted by secondary elements? Product pages: Are users interacting with images, descriptions, or buttons that drive conversions? Checkout processes: Are there specific steps where users abandon the process, signaling frustration or confusion? The ability to assess different paths individually empowers businesses to continuously refine key pages for higher engagement and conversion.
In-Depth Analysis & Use Cases:
The Hotspots feature offers comprehensive insights into user behavior, which can help businesses make data-driven decisions to optimize user experiences, increase conversions, and enhance website/app performance.
Maximizing Conversion Potential:
-
By analyzing hotspot data, businesses can assess whether critical elements like call-to-action buttons, forms, or purchase links are being used as intended.
-
If high-value elements are not receiving enough clicks, businesses can test different placements, colors, or copy to better capture user attention and drive higher conversion rates.
-
A/B testing: Hotspot data is ideal for A/B testing, where businesses can compare the impact of different design choices on user behavior to identify the most effective variations.
Improving User Experience:
-
The Rage Clicks metric is a valuable indicator of frustration. By identifying areas of the site where users are repeatedly clicking without the desired outcome, businesses can quickly resolve usability issues that are leading to poor user experiences.
-
For example, rage clicks on a button might suggest that users expect the button to perform an action that it doesn’t, or that the button is malfunctioning.
-
Identifying and fixing such friction points can result in a smoother, more intuitive user experience, reducing bounce rates and increasing overall satisfaction.
Page Layout Optimization:
-
By visualizing the areas of a page that receive the most clicks, businesses can assess the effectiveness of their page layouts. Elements that are meant to attract attention but receive few clicks might be poorly positioned, while non-interactive elements with high click activity may be misleading users.
-
Businesses can then optimize layouts to better guide user attention, ensuring that high-value elements are more prominent and accessible.
Campaign & Content Effectiveness:
-
The time range filter allows businesses to measure how specific events, promotions, or changes in content impact user behavior.
-
For instance, businesses can see how the launch of a marketing campaign increases page views or clicks on specific elements like buy now buttons or signup forms.
-
Analyzing how behavior evolves over time provides insights into what works best for different segments of users and allows for continuous content improvement.
Device-Specific Interaction:

-
With support for multi-device tracking (desktop, mobile, tablet), the Hotspots feature helps businesses understand how interactions vary across different devices.
-
This is especially useful in ensuring that mobile users, for example, experience a site that is just as intuitive and functional as its desktop counterpart.
-
Device-specific analysis enables businesses to create more tailored, device-optimized experiences, ensuring that all users can easily navigate and interact with their site or app.
User Flow Analysis:
-
The ability to analyze individual paths allows businesses to track the user journey across different sections of their site or app.
-
For example, businesses can monitor the entire flow of a checkout process, identifying where users drop off or become frustrated, and making improvements to reduce friction and increase conversion rates.
-
This ensures that businesses can fine-tune user flow, reduce abandonment rates, and create seamless, enjoyable experiences.
Why Hotspots is Essential for Businesses:
The Hotspots feature is an invaluable tool for any business looking to understand and improve how users interact with their digital platforms. By providing comprehensive data on where users click, where they encounter frustration, and how they navigate through pages, Hotspots empowers businesses to make informed decisions that drive user engagement, increase conversions, and enhance overall user satisfaction.
Key benefits include:
-
Data-driven optimization: Businesses can rely on real-time data to make meaningful changes that improve key metrics such as conversion rates and engagement.
-
Enhanced user experience: By identifying and addressing pain points and usability issues, businesses can deliver a smoother, more intuitive experience for users.
-
Actionable insights for growth: The insights gained from Hotspots help businesses refine their websites and apps, aligning them more closely with user expectations and needs.
In short, Hotspots provides the detailed analysis that businesses need to continuously evolve and improve their digital presence for maximum impact.