Retention
Introduction
In an increasingly competitive market, understanding and improving user retention is pivotal for the success of any application. Retention refers to the ability of a product or service to keep its users engaged over time. This metric is a key indicator of user satisfaction, product-market fit, and long-term viability of a business model.
How It Helps Businesses
Focusing on retention helps businesses in several critical ways:
- Prevents User Drop-Off: By analysing when and why users are dropping off, businesses can implement targeted interventions to retain them.
- Improves User Engagement: Regularly monitoring retention rates can highlight opportunities to improve user engagement through product tweaks or additional features.
- Increases Revenue: Retained users are more likely to make repeat purchases and can become a reliable source of revenue.
- Enhances Product Development: Retention data can inform the development team about which features keep users coming back and which may need improvement.
Sample Use cases -
- How many Users continued payment of their monthly subscription over time and how many drop-outs are there each month.
- How is repetition of Order_Placed event in city Bengaluru vs Delhi.
- What percentage of users are still using "Nudge" feature after 30 days
- How many users never came back after 3 months from account creation
Types Of Retention Views
We support two types of retention views. These views can be toggled from top right corner.
Repeat View
Repeat view indicates how many users in a given period (day/week/month) have repeated from the immediate previous period (such as the last day, week, or month) within a certain time range (like the last 3 months)."
Retention Curve
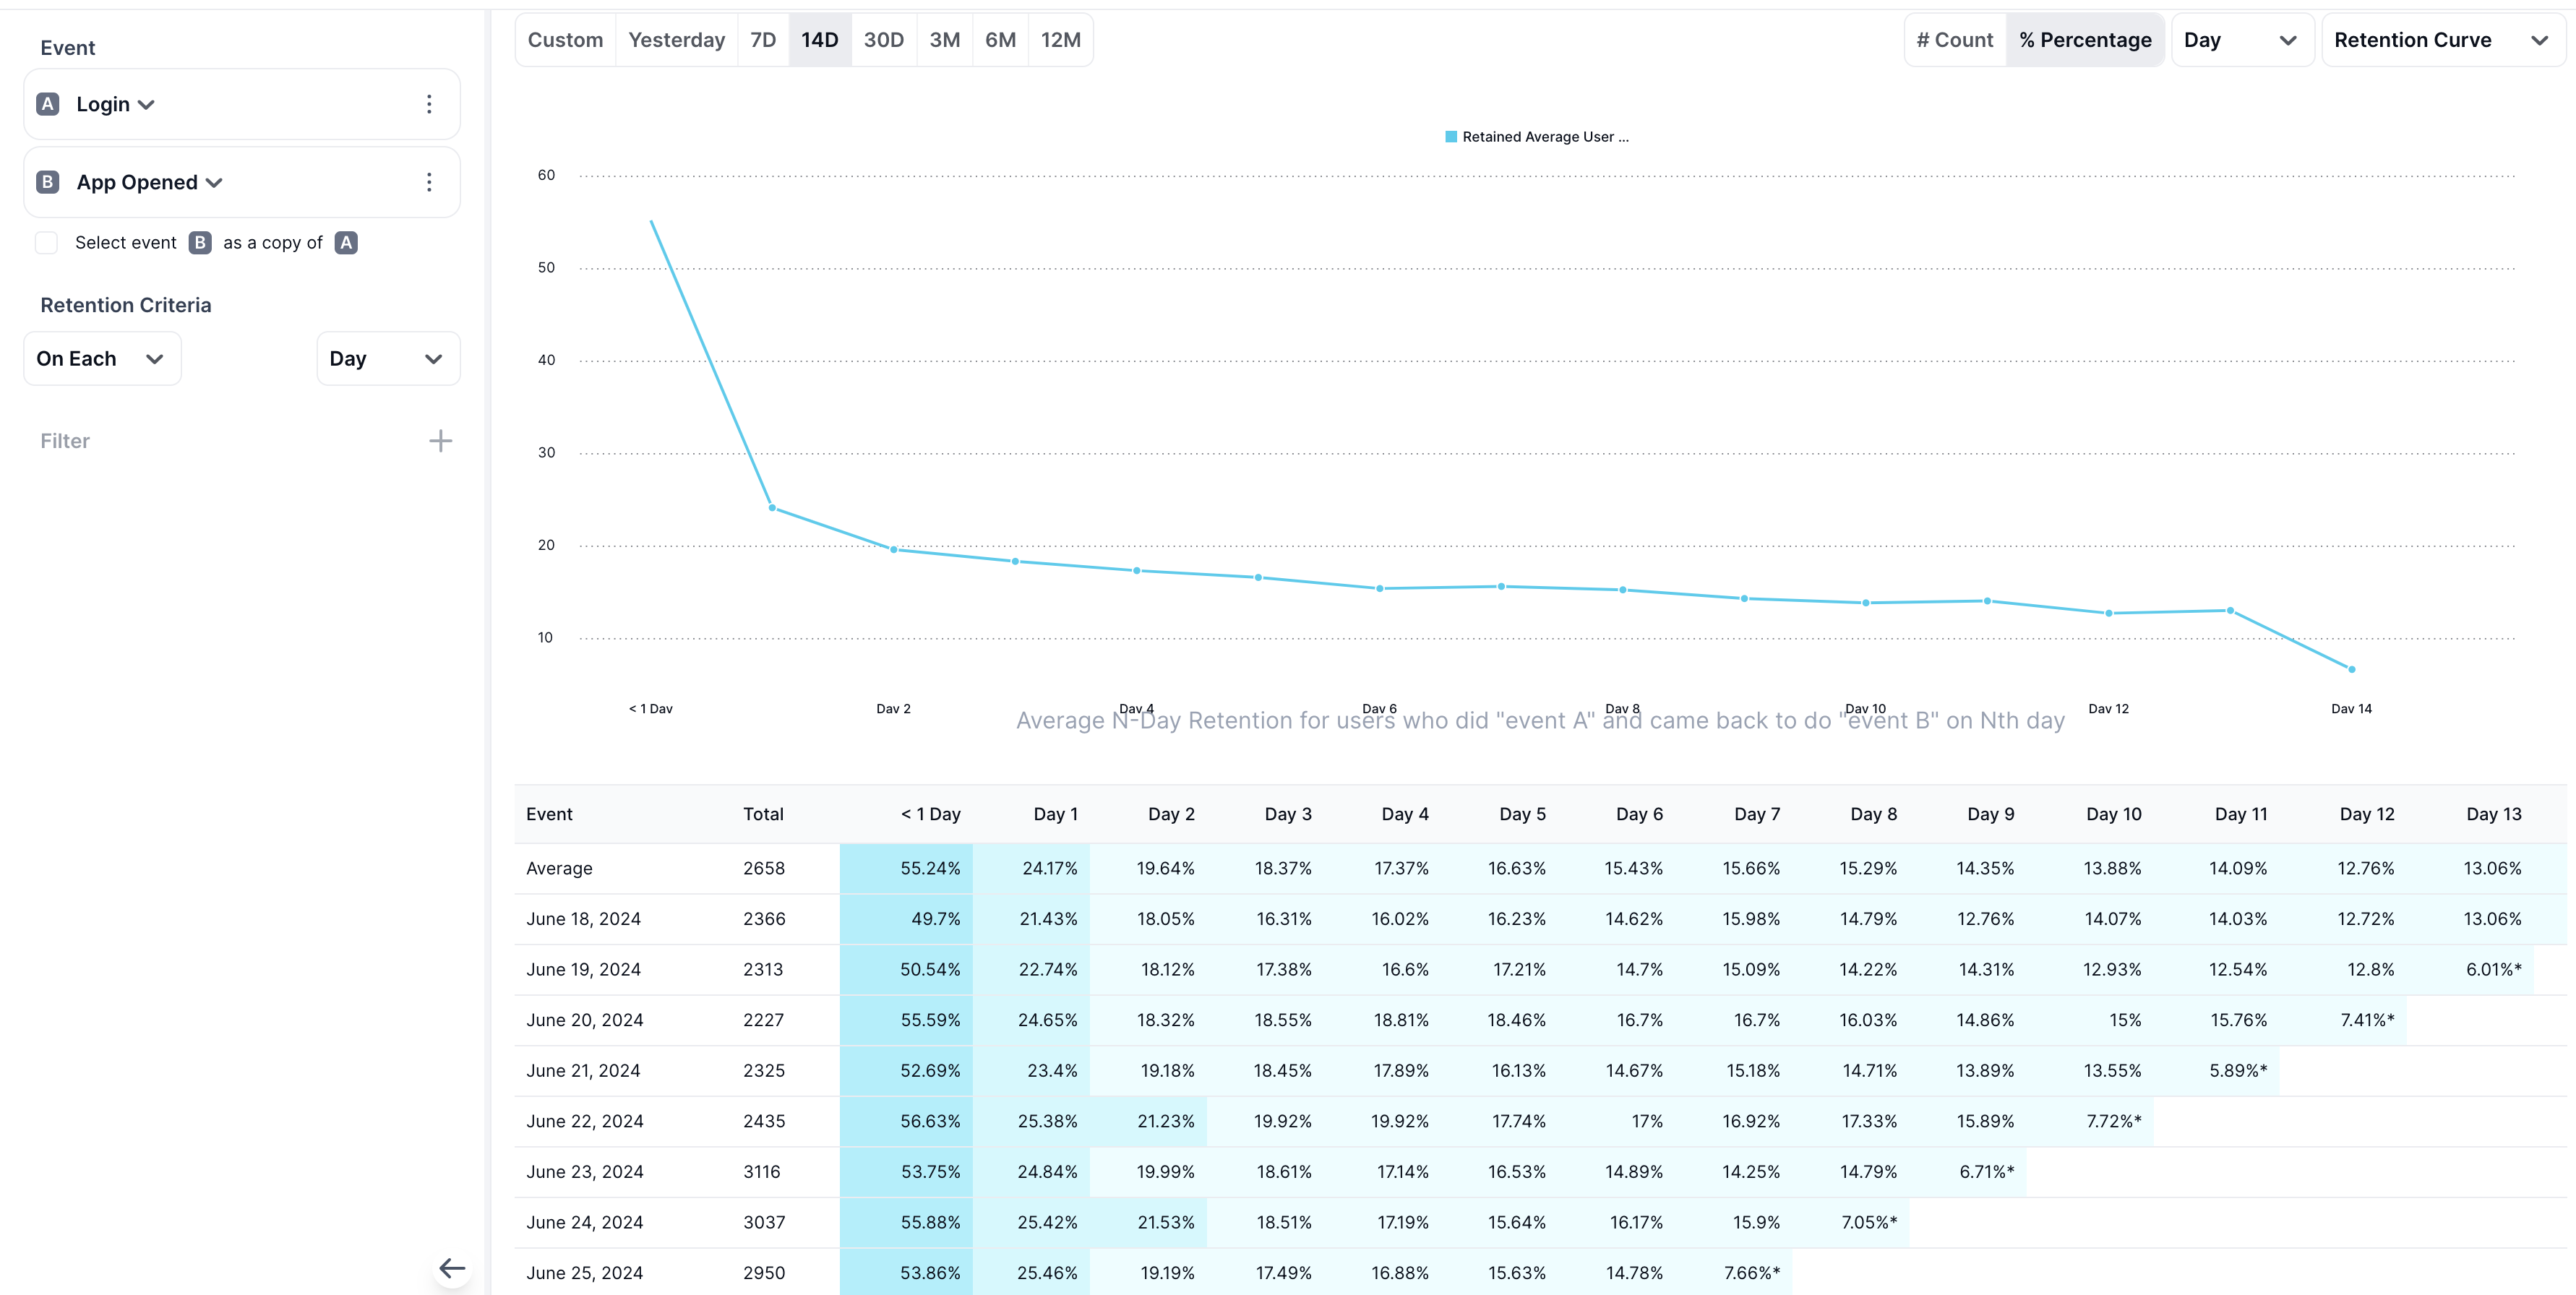
The retention curve provides a detailed view of the retention pattern for users who arrived within a given period, tracking their return in each subsequent period. For example, it can show how many users who visited during the week of 17th June returned in the same week, the following week, two weeks later, and so on, for each week up to the present date.

Repeat View
Overview
Our repeat view is a handy tool for checking how well your app is keeping users. You can pick any event, like 'App Opened', to look at how often users come back. If you want, you can also use filters to narrow down your view, like setting 'platform' to 'Android'. The repeat view shows how many users come and repeat from last period (day/week/month) to the current over a set of time range, like the last three months. By choosing your time range and retention period (day/week/month), you can get a clear picture of how your app's user retention is doing over the duration.
How to Use
To leverage the Repeat feature for your business, follow these steps:
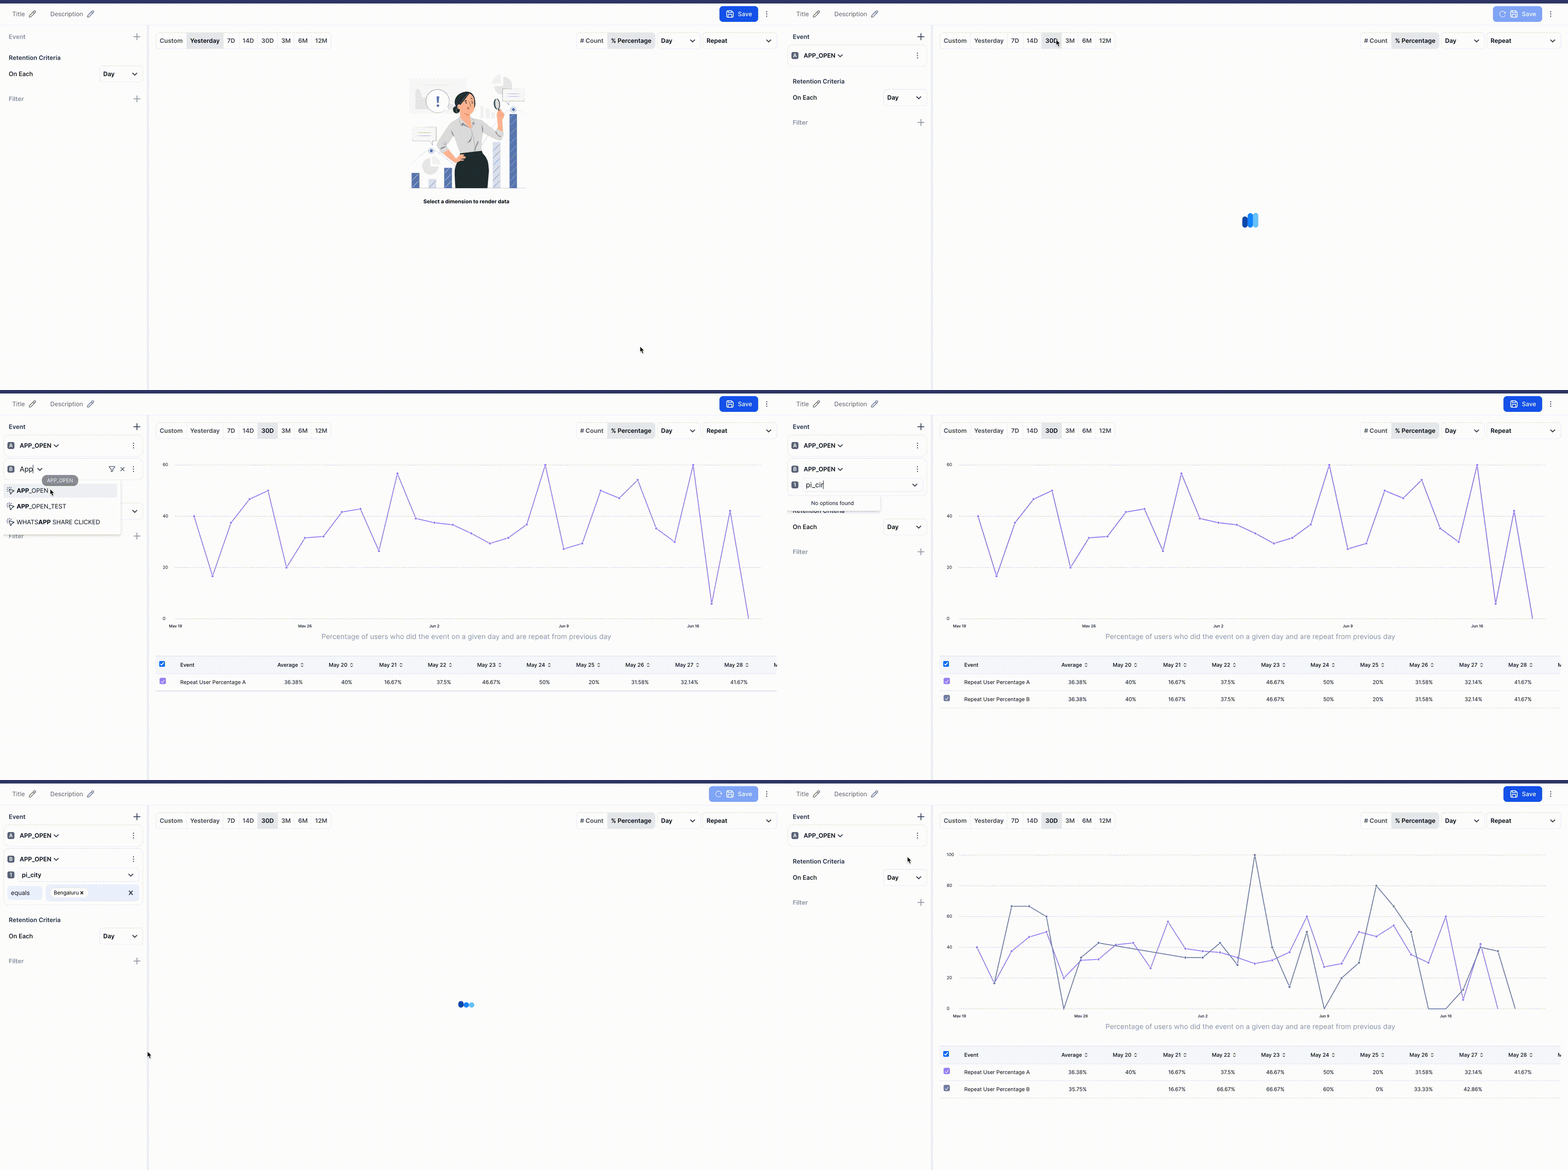
1. Choose your view type
Choose repeat as view type
2. Select the User Event
Identify the key user event you want to analyze for retention, such as "App Open." You can choose multiple event too or choose same event in multiple graphs with different filters for comparison.
3. Apply Filters
Set filters to segment the data based on specific criteria, such as operating system, user demographics, campaign type or device type.
4. Choose Retention Criteria
Select the time interval for retention analysis — daily, weekly, or monthly.
5. Define the Historical Time Frame
Pick the time span for the retention analysis, such as the last 30 days, 60 days, or custom date ranges.
6. Select the Desired Metrics
Choose to view the retention data as either a count of repeat users or as a percentage of total users for each period.

How it works
(Note : Weekly and Monthly Retention will use calendar weeks and months only. Example - If we are checking weekly retention on 23 May 2024 (Thursday) , It will segment data by calendar Monday to Monday rather than Thursday to Thursday. So the weeks will be like (13 May - 19May) and (20 May - 26 may). Same goes for month. )
So if we choose to see Weekly retention over last 3 months data, we would get weekly repeat user count and percentage of users who have performed event “App Open” on andriod platform anytime in a given week and out of them how many users are repeated from immediate previous week for the same event on android.
For example, “Week 3 Repeat Count” would show how many users, who performed the defined the event criteria in week 3, and are also repeat from week 2
So who is a repeat user? Lets say we take a user who has performed an event (with applied filter criteria fulfilled) on following dates in 30 days window (7 may to 6 June) :
| Timestamp | (calendar week) | (Reference week number) |
|---|---|---|
| 2024-05-07 14:56:00 | 6 May - 12 may | week 1 |
| 2024-05-09 11:16:00 | 6 May - 12 May | week 1 |
| 2024-05-13 15:25:00 | 13 May - 19 May | week 2 |
| 2024-05-28 16:56:00 | 27 May - 2 June | week 4 |
| 2024-05-28 18:45:00 | 27 May - 2 June | week 4 |
| 2024-05-30 03:13:00 | 27 May - 2 June | week 4 |
| 2024-06-03 19:17:00 | 3 June - 9 June | week 5 |
| 2024-06-06 14:56:00 | 3 June - 9 June | week 5 |
So the user will be repeat user in week 2 as he is repeat from previous week (week1 ) too.
The user will be NOT repeat user in week 4 (even though he performed event two times in week 4) as he did not perform event even once in week 3.
Similarly, the user will be a repeat user in week 5 as he performed event in week 4 too at least once.
Explanation of Graph
Now what does the graph say? There are two views available which can be toggled from top right corner - Count and Percentage
- Count - Exact Count of users in current period (day week or month) who are repeat from previous period
- Percentage - Out of all the users who performed a given event with given filter conditions in a given period (like week), what percentage of them were also present in immediate previous period too.
Example - Lets say there were 100 users in week 3 and 200 users in week 4. Let’s say there were 50 users who are common in week 3 and week 4.
In this case Repeat Count of week 4 will be 50 as 50 users repeated from last week.
Repeat Percentage in week 4 will be 50 / 200 = 25%. (Users Repeated from previous week) / (Total Users in current week for the event and filter) * 100
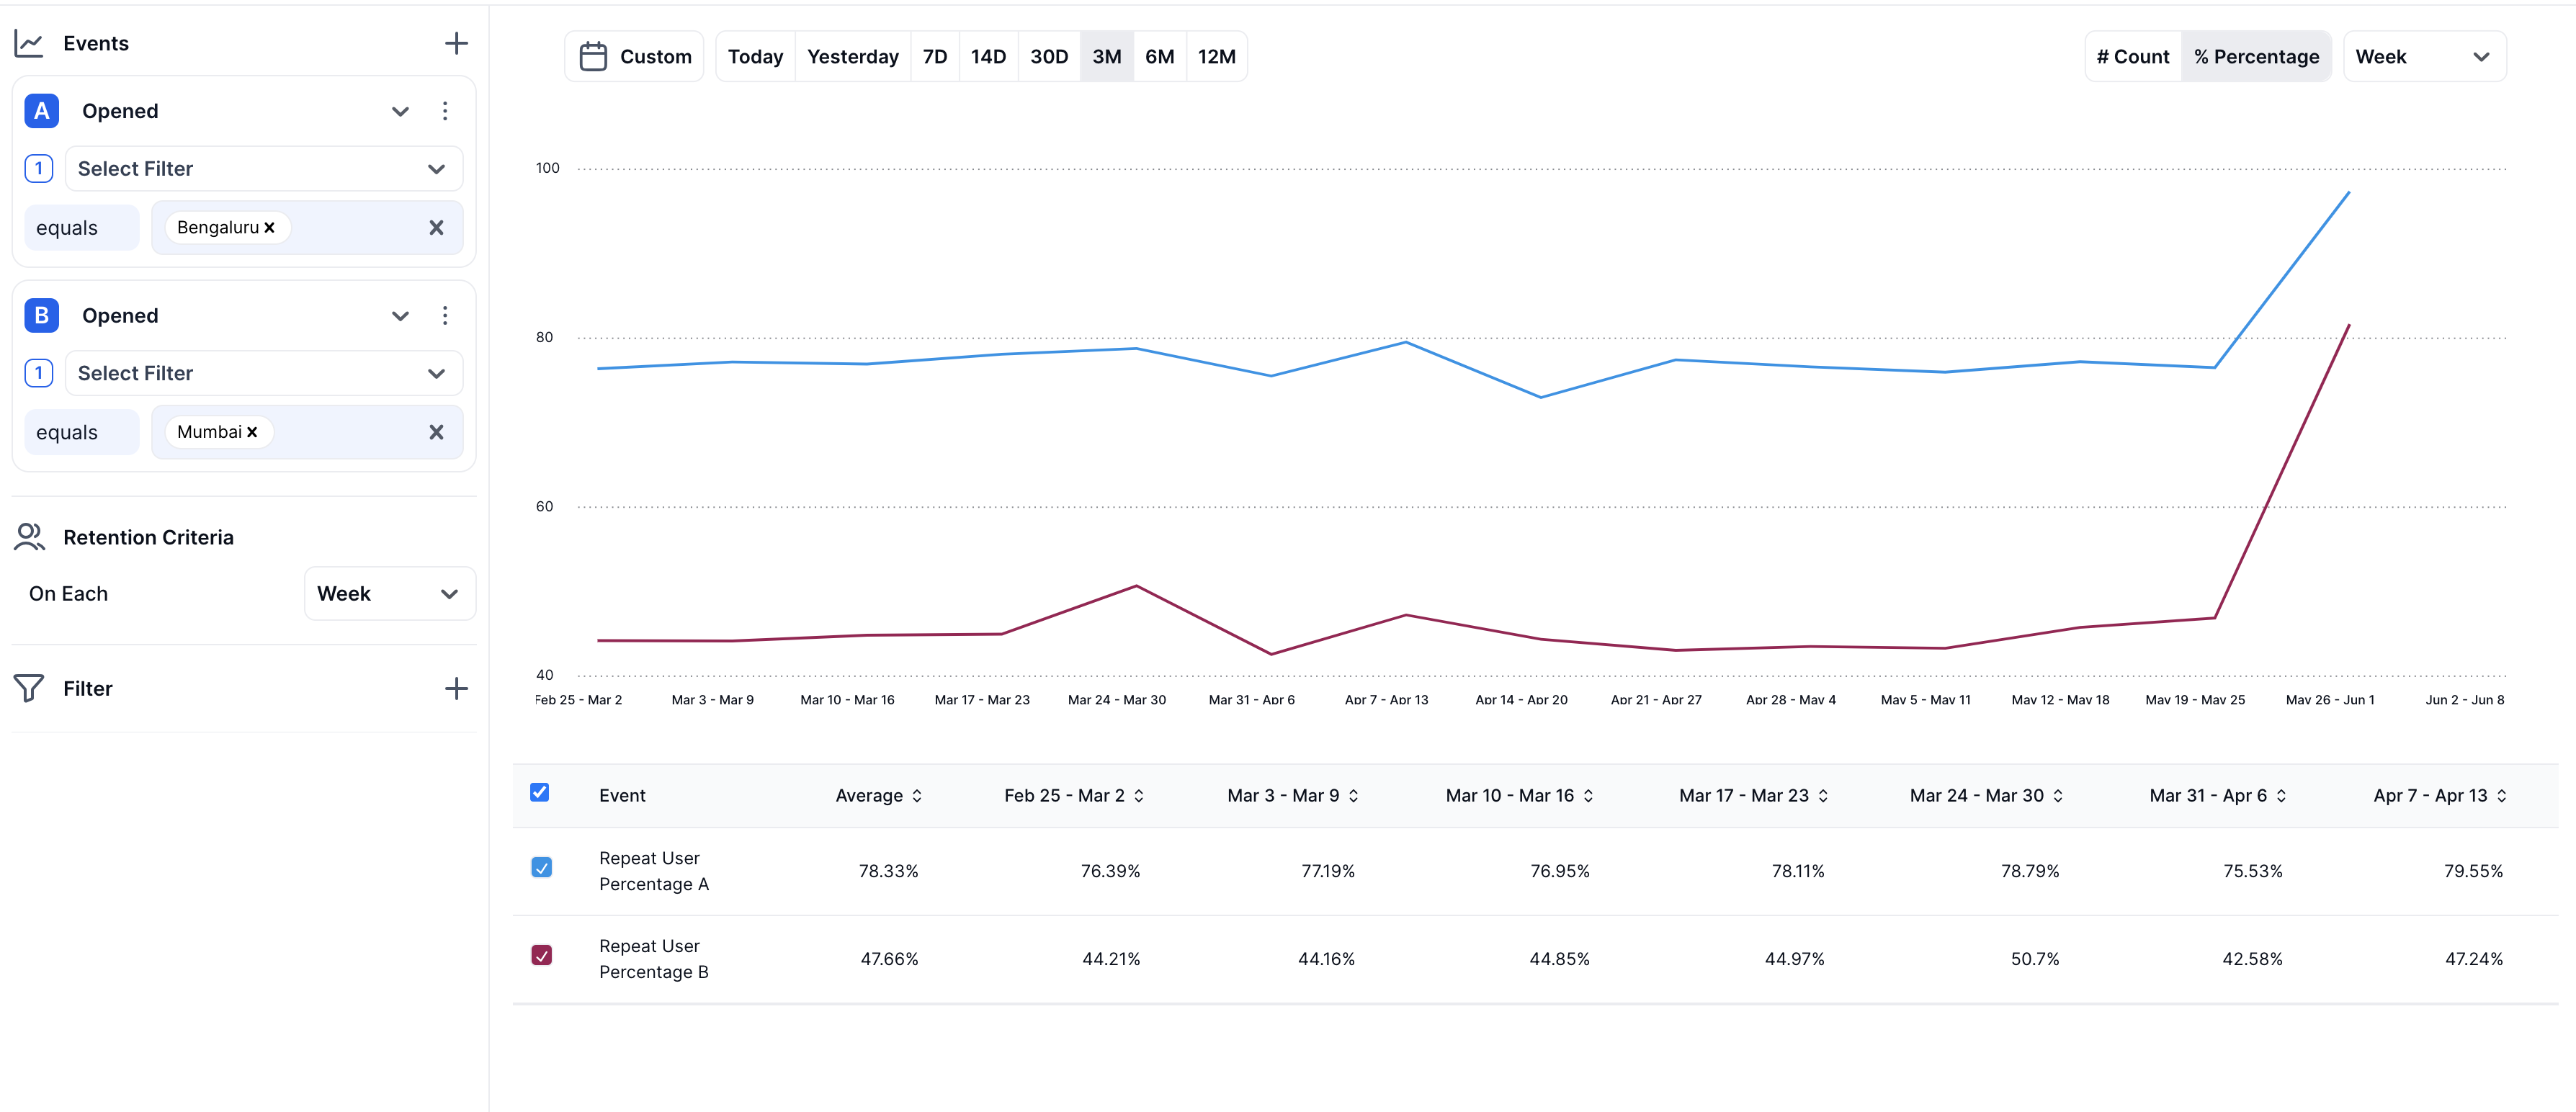 In above example we compare retention of event OPENED among city Bengaluru and Mumbai. Here we have chose percentage view. So as evident, Graph A (Blue) represents Bengaluru and graph B (red) represents Mumbai. So for week (March 3- March 9) there were 77.19% of users who were repeats in Opened Event from previous week (Feb 25 - mar 2) for city Bangalore. Similarly this percentage was 44.16% for Mumbai.
Retention Curve View
Overview
The Retention Curve is a crucial analytical feature in our application, designed to provide insights into user behavior and engagement over an extended period. This feature enables stakeholders to visualize how effectively the application retains users after their initial interactions. More importantly, it illustrates the long-term sustainability and growth potential of the business by demonstrating which segments of users are retained over various periods. Additionally, it highlights the rate at which users disengage and depart from the platform after specific durations.
How To Use
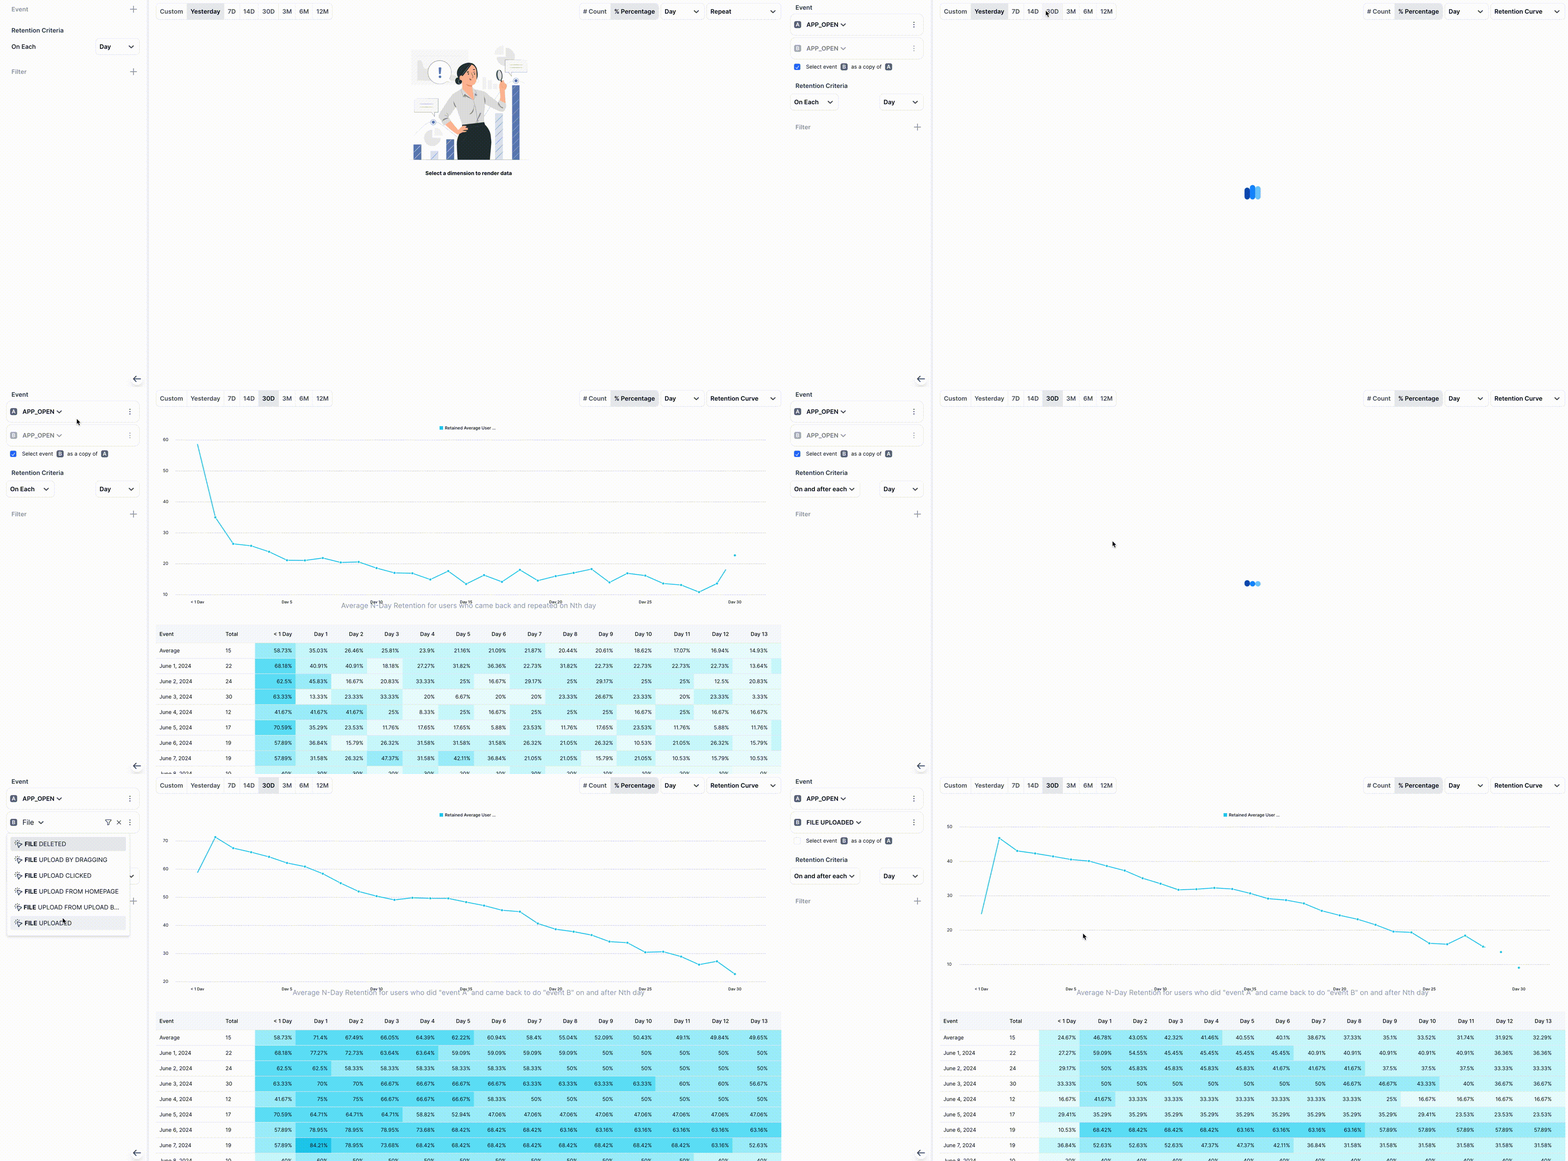
1. Choose your view type
Choose retention-curve as view type
2. Select your events
This is perhaps the most important field from business standpoint. Decide what is the definition of retention for your business.
Like users who are performing "APP_OPEN" and repeating "APP_OPEN" over periods of time. Or you can have definition like users who have done "Account_Created" as start event A and retention event as "APP_OPEN" which would signify that once a user has created account how ofter are they returning by doing "APP_OPEN" over each of next few days/weeks/months.
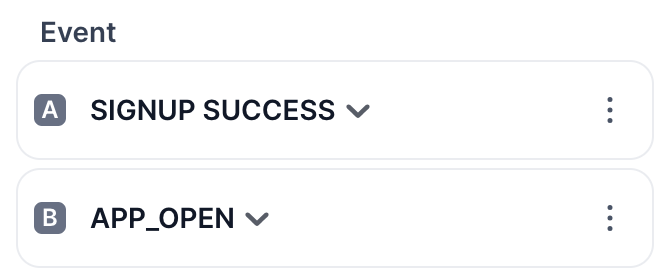
A is your start or initial event and B is your retention condition
3. Apply Filters
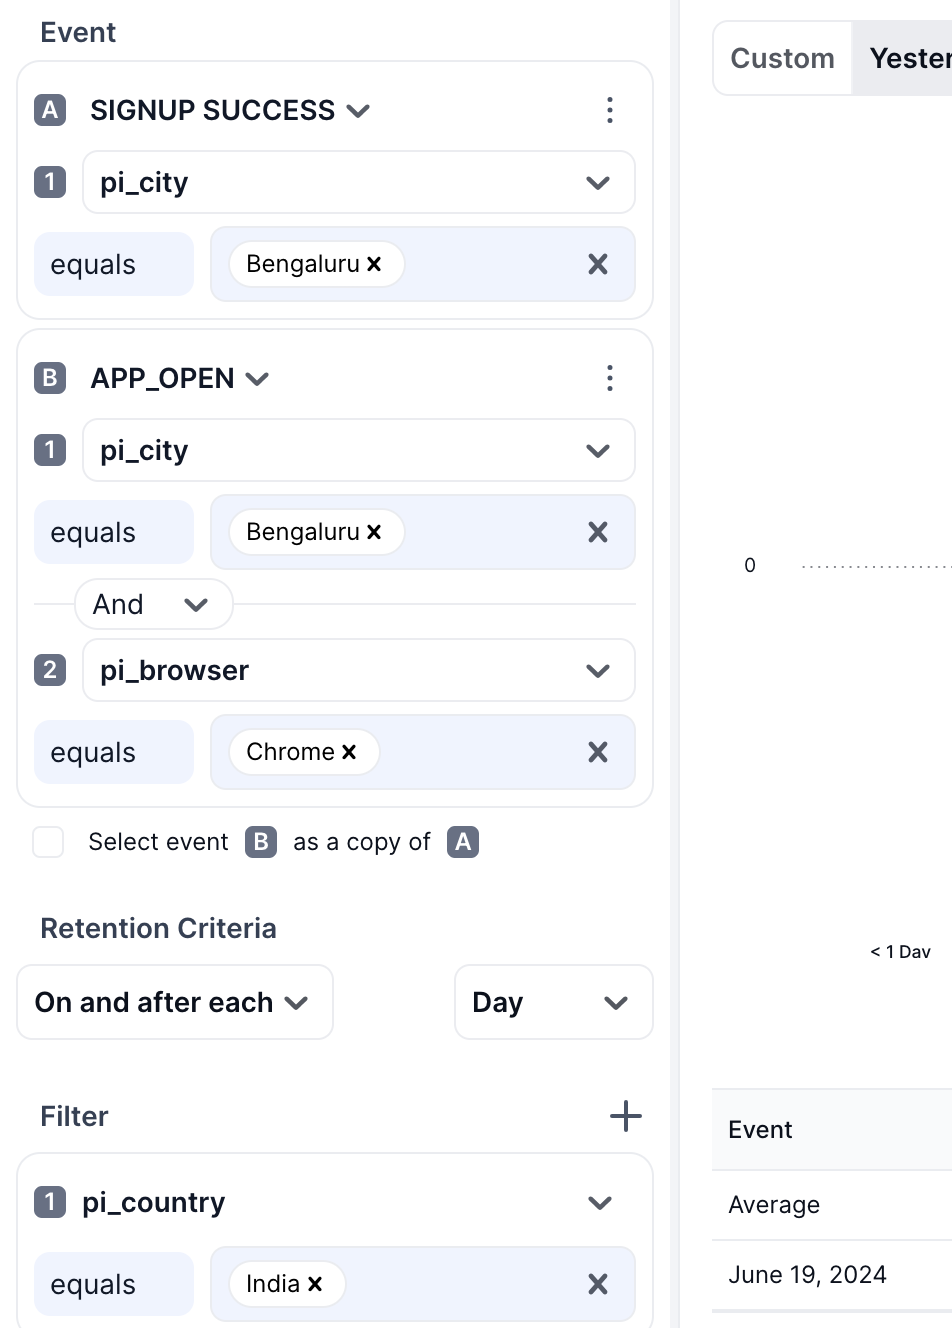
Set filters to segment the data based on specific criteria, such as operating system, user demographics, campaign type or device type. You can apply any filter on A and B separately too. You can also add global-filters in filter section at end of left panel like below on top of them. Here is an example for same
- Note -
- A current restriction is that you cannot choose same event in A and B with different filter. You can choose different events with any or no filter config. But for same event you can use same filter config only or in other words,for same event A and B should be copy of each other. To facilitate this we have added a checkbox for easy copy of A in B for same event.
4. Choose Retention Criteria
Select the time interval for retention analysis — daily, weekly, or monthly.
5. Define the Historical Time Frame
Pick the time span for the retention analysis, such as the last 30 days, 60 days, or custom date ranges.
6. Choose Retention Criteria
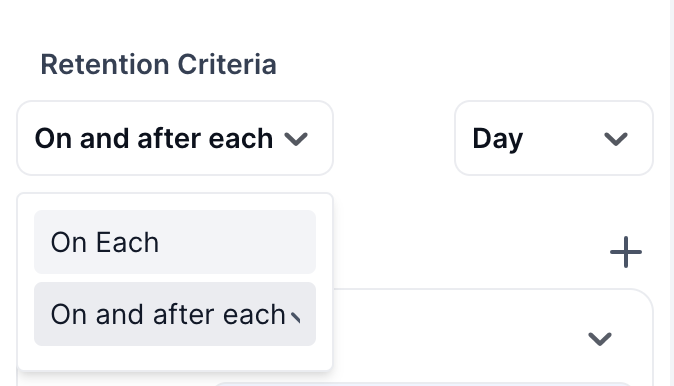
There are two types of retention criteria currently supported
- On - For finding out user who returned exactly on a given window period. Like exactly on 5th day after 10th June.
- On and After For finding out user who returned on or ever after a given window period. Like user who came back on or after 5th day from 10th June which will include all days from 15th june till the last date in range.
7. Select the Desired Metrics
Choose to view the retention data as either a count of retained users or as a percentage of total users for each period.
How it works
Upon selecting your initial event "A" and retention event "B" with necessary filters and choosing appropriate retention period like "day", "week" or "month", our business definition of retention of queried period (like last 7 days, last 3 months) now becomes -
For each period (day/week/month) in given time range queried (like last 3 months), out of all the users who performed "A" in a given period, how many of them came back and performed "B" either on or on-and-after each of subsequent periods (like on same week, on 1st week, on 2nd week... and so on after a given date of week).
If for a given date a user comes back on or on-and-after N period counts, he becomes part of N-Period retention. Like for week period, if a user did A on week starting from 3-June and comes backs and did B on 3-June week, 17th June week(2 week later) but never after then in case of "on" he will be part of < 1 week retention, 2 week retention. In case of On and after, he will be part of < 1 week, 1 week (he came back "on and after 1 week" due to the fact that he came on "2nd week"), 2 week as he came on that week, but he wont be part of any other period as never came back "ON and After" week 3 ever.
Now let's take an example with some event A and B with retention period as DAY and time range as last 7 days.
1. On Retention
There are two metrics we can see - Count and Percentage. Let's First look at count and then percentage
a) Count
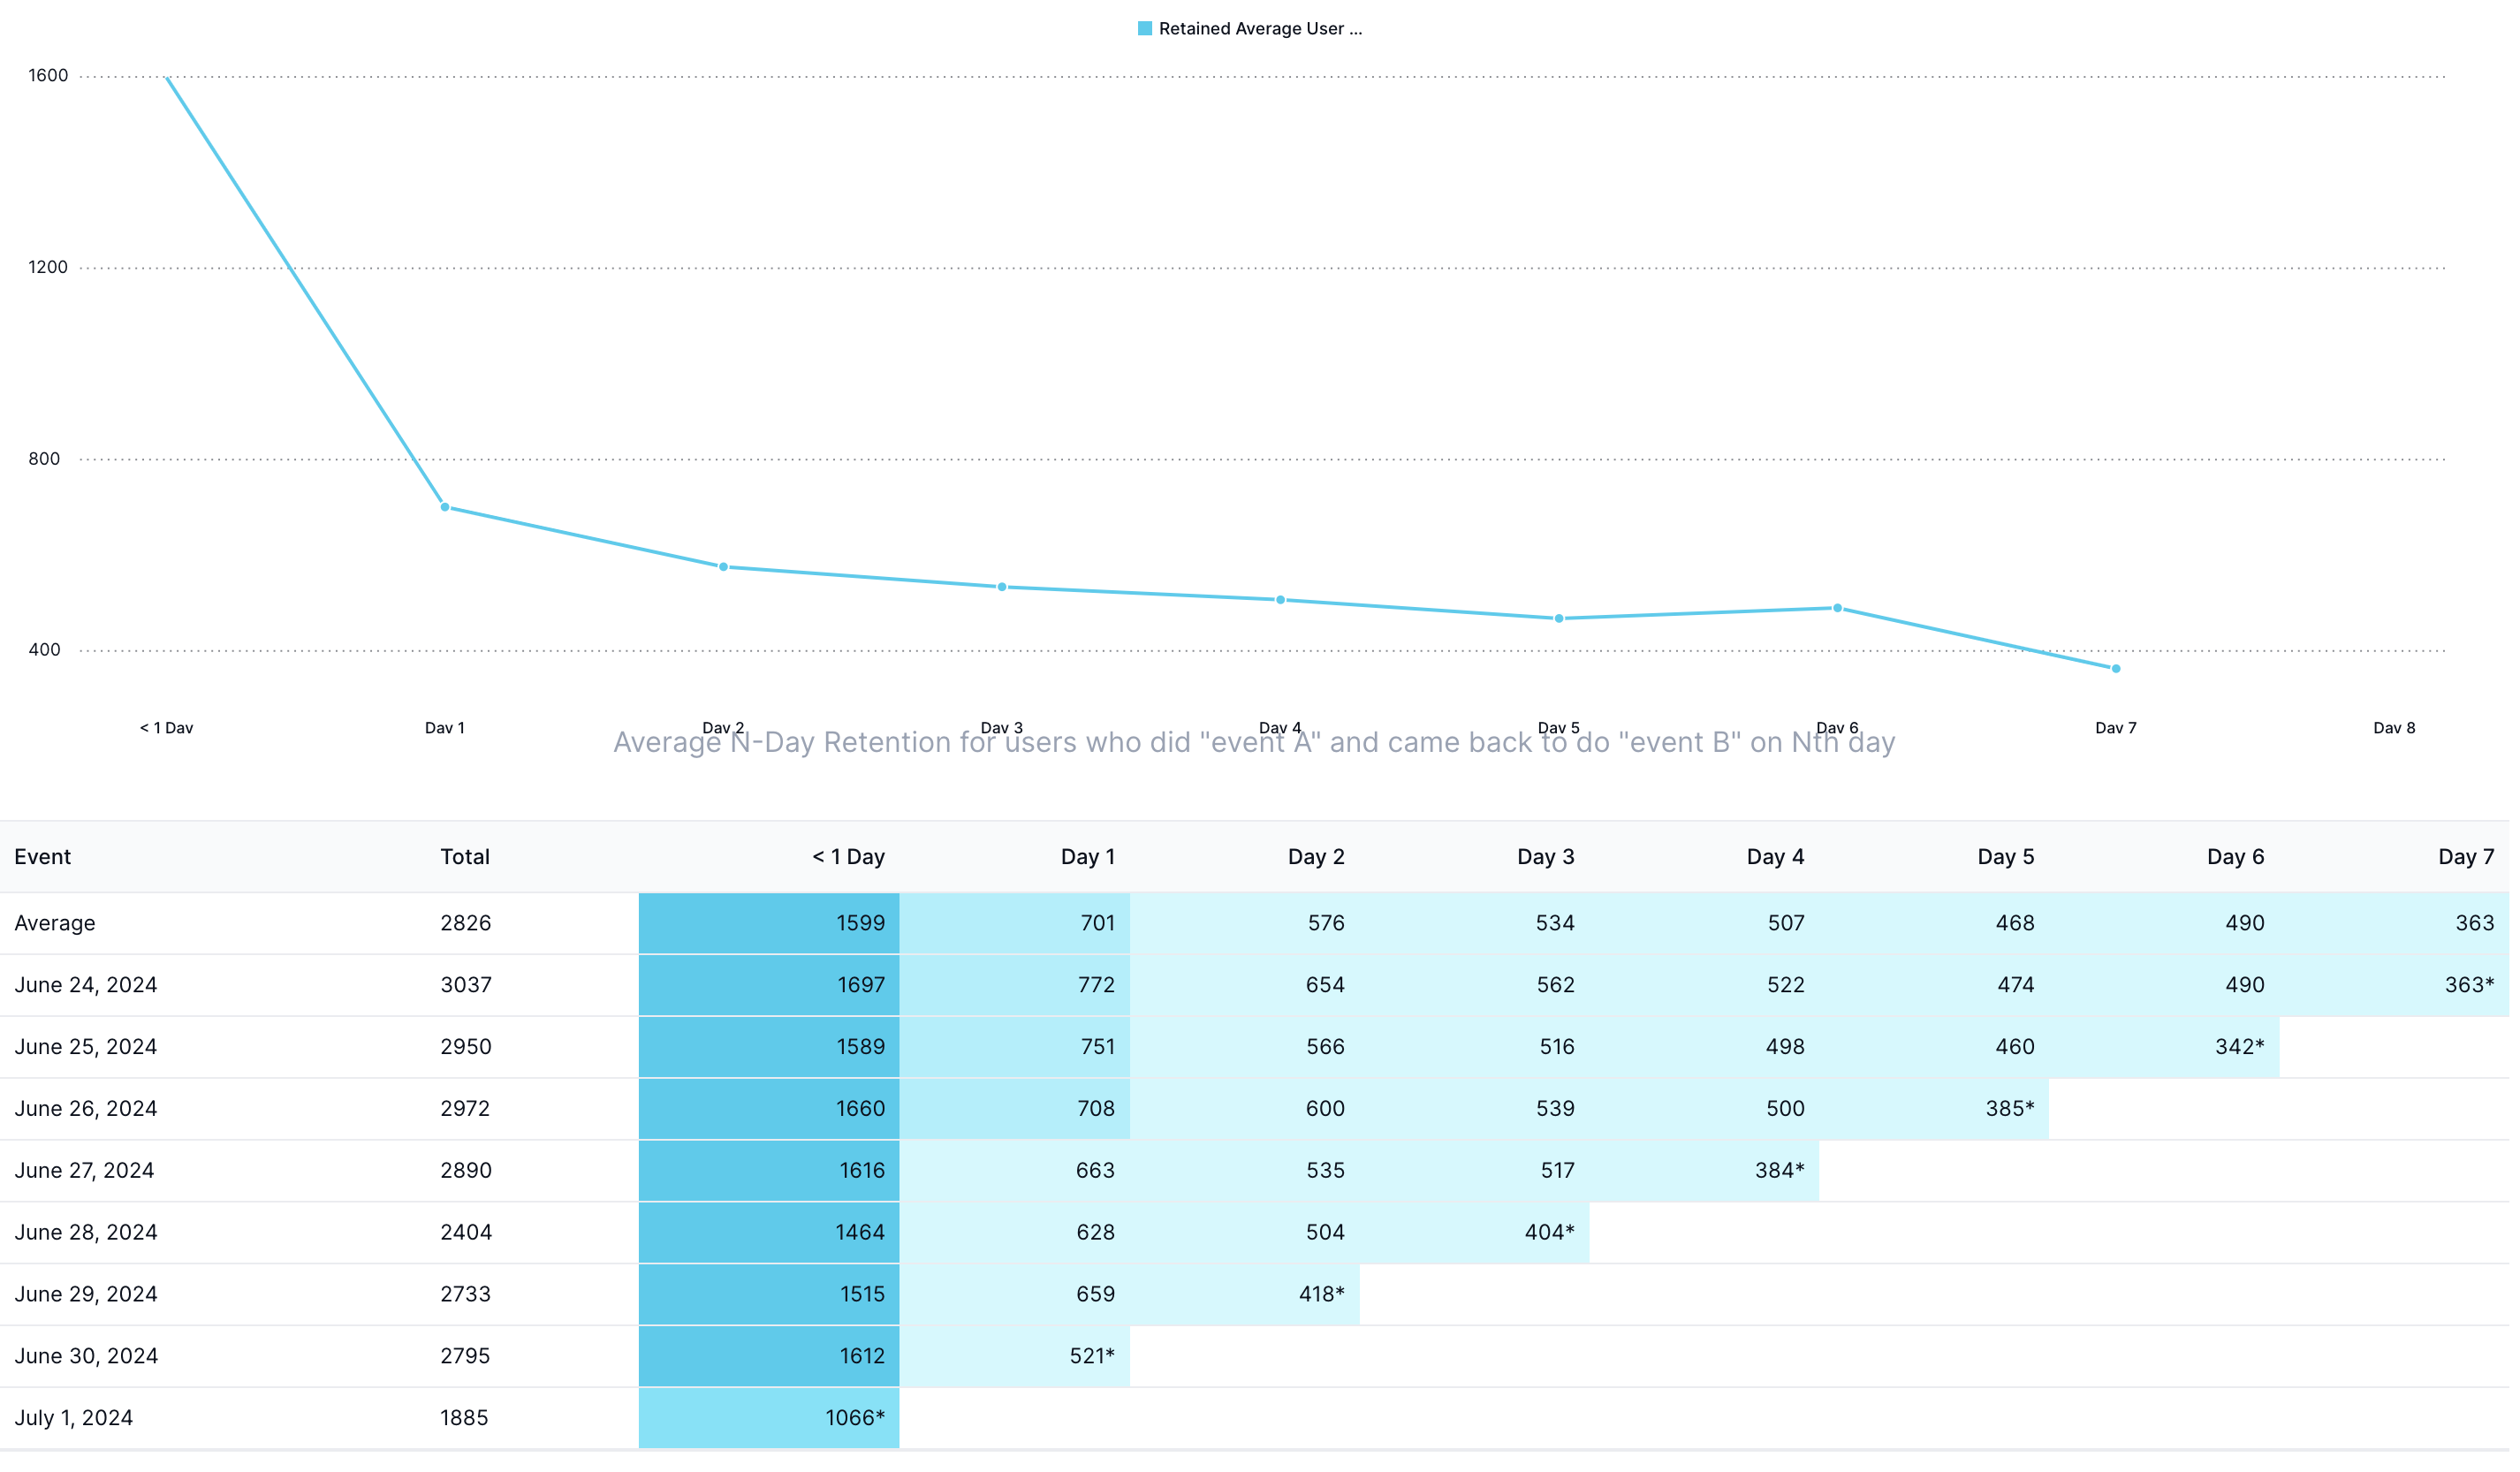
Let's now deep dive into what each of those data means. Let us take example of June 28 2024, where there are data for Total, < 1 Day, Day 1, Day 2 and Day 3. Here is consolidate view of what each data point represents.
| Column name | value | significance |
|---|---|---|
| Total | 2404 | Total count of users who performed event A on June 28 |
| < 1 Day | 1464 | Users who did event "B" on the same date (can be week or month too depending on repeat period) |
| Day 1 | 628 | users who did event "B" exactly 1 day later i.e out of 2404 users who did A on 28 June, 628 users did B on 29 June. |
| Day 2 | 504 | users who did event "B" exactly 2 day later i.e out of 2404 users who did A on 28 June, 504 users did B on 30 June. |
| Day 3 | 404* | users who did event "B" exactly 3 day later i.e out of 2404 users who did A on 28 June, how many did B on 1 July. |
- Note The Astrix (*) mark on any data point shows that the data for that point is still ongoing. Like on the day (1 July) of this example, 1 July has not yet ended and data is still flowing. In same way 3 day data of 28 June corresponds to 1st July and is incomplete and ongoing hence has * mark.
What does average row means?
For each N day retention and total, we take the "Weighted" average of retained users across all days, where the weights are total user count for that date. So for average row here is what each data means
| Column name | value | significance |
|---|---|---|
| Total | 2826 | Average of total users across all dates |
| < 1 Day | 1599 | Weighted Average of all < 1 Day retention from Jun 24 to Jun 30. We add weights based on total user column for each of those dates. Note that we removed 1st July from weighted average as it has not completed yet. |
| Day 1 | 701 | Weighted Average of all Day 1 retention from Jun 24 to Jun 29. Note that July 1st is missing from range as 1 day column as (July 1) + (1 day) = July 2 has not started yet. We have also not included (June 30)'s Day 1 data as (June 30) + (1 Day) = (1st July) is ongoing. |
| Day 2 | 576 | Weighted Average of all Day 2 retention from Jun 24 to Jun 28. Note that beside July 1, June 30 is also missing from range as 2 day as (June 30) + (2 day) = (1st July) has not started. Also, (June 29)'s Day 2 data is not included in average as it refers to 1st July which is ongoing and incomplete. |
| .... | ||
| Day 7 | 363 | Weighted Average of all Day 1 retention from Jun 24 to Jun 24. Note that in the given range, only for 24 June + 7 Day i.e. July 1st has started. Since for 7 Day only one incomplete/ongoing window is present then that itself is average |
How does this weighted average works? Let us take example of Day 5 average retention.
| Date | Total | Day 5 Retained Users |
|---|---|---|
| June 24 | 3037 | 474 |
| June 25 | 2950 | 460 |
| June 26 | 2972 | 385* |
We do not include June 26 Data in day 5 average as it is ongoing data.(June 26 + 5 day = 1st July)
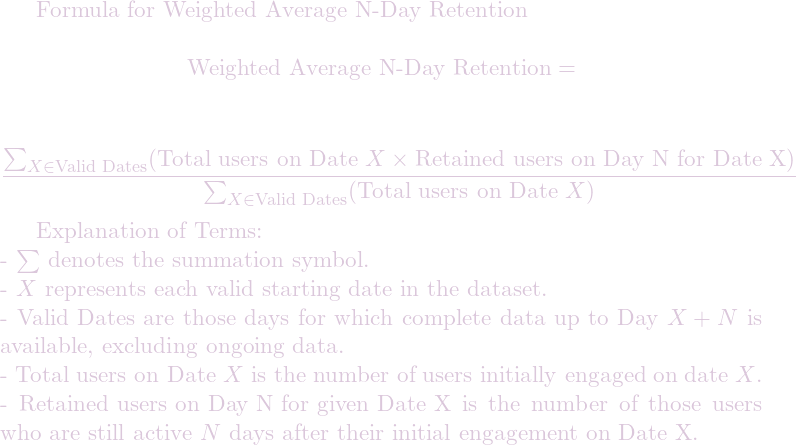
So average Day 5 retention would be ( 3037x474 + 2950x460 ) / (3037+2950) which equals 467.1, we then upper round it to 468.
If for any N-Day there is only one data that too incomplete, then that data itself becomes average (like Day 7 Retention)
Explanation of graph
The graph rendered is simply the Average Row of table. It represents that over period queried, on average how many users come back and perform event B on same Day (< 1 Day), 1st Day, 2nd Day, 3rd Day or N days after performing their initial events. It can be any of day, week or month retention criteria.
In previous example, < 1 Day (same day retention) is 1599. It means that on average 1599 over last 7 days (24 June to 1st July )users came back and did event B on same day as doing their initial A. Day 2 average retention = 576 means that on average 576 users came back and performed B on 2nd Day after their initial event A.
b) Percentage
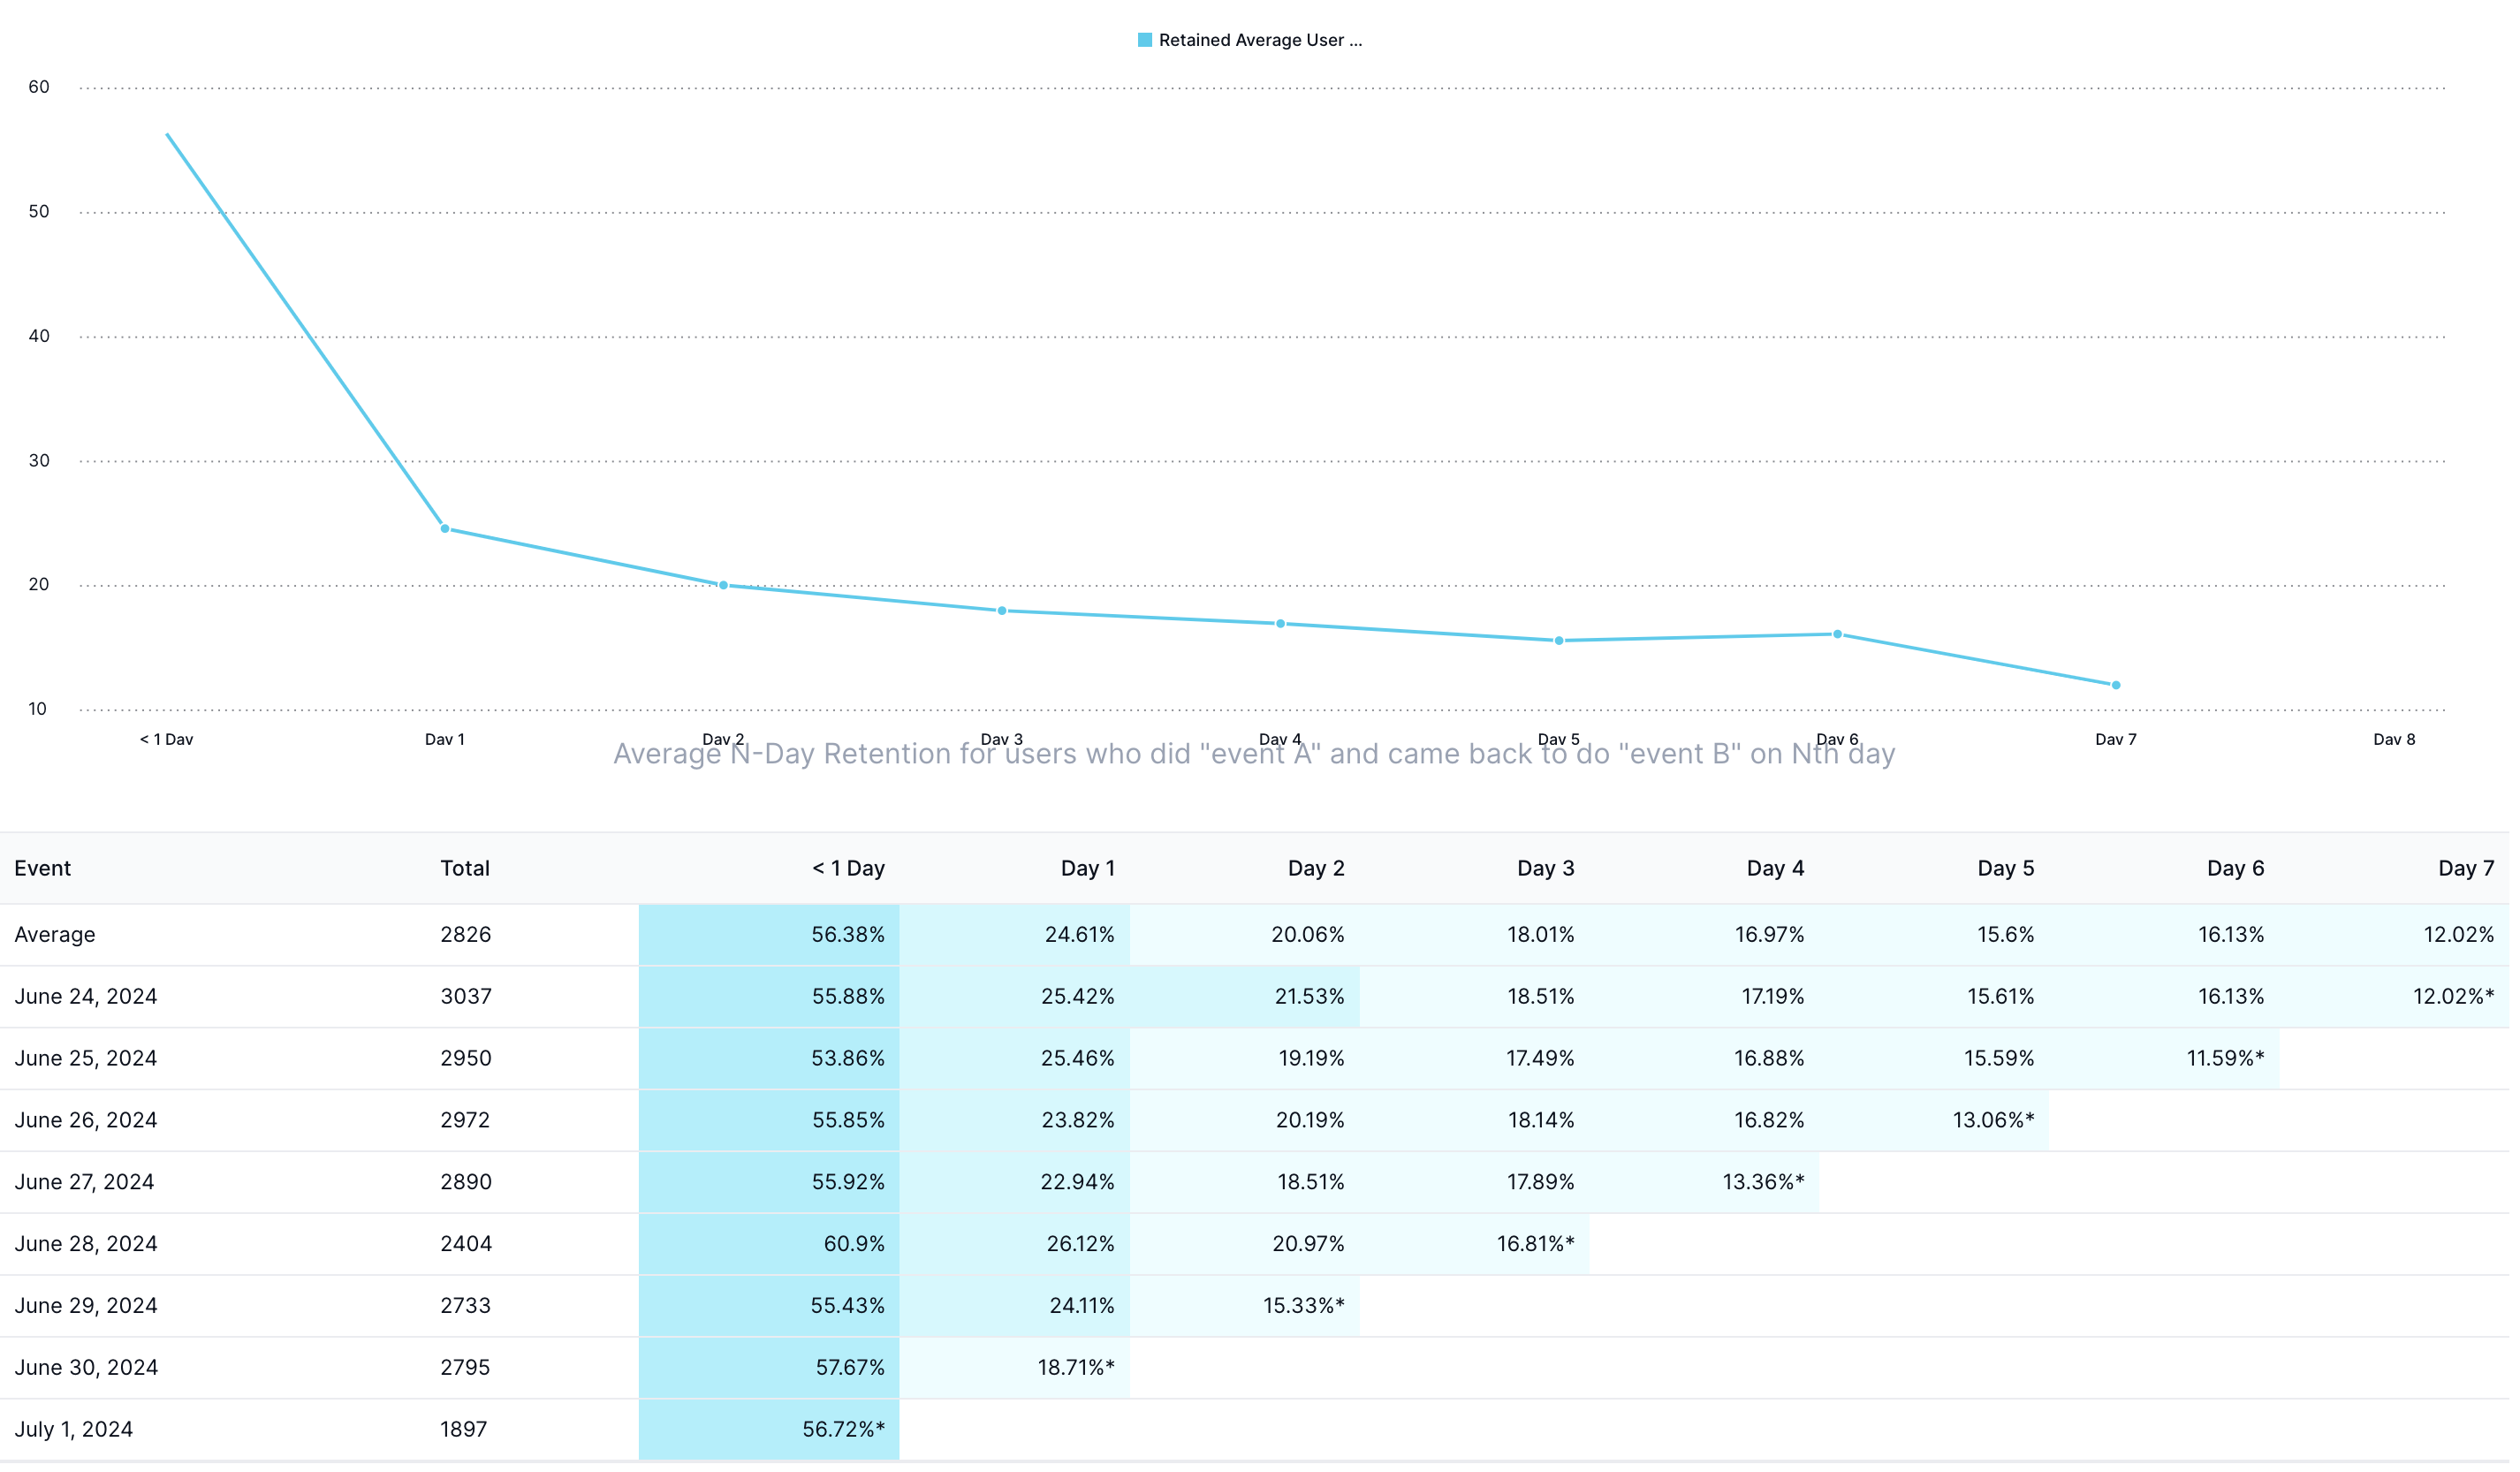
Percentage simply shows on a given Date 'D' and for a given N-Day/Week/Month retention 'N', what percentage of users who initially performed A on Date D came back on Nth Day/week/month after D and performed event B Now let us take example of 28 June as we saw in case of count.
| Column name | value | significance |
|---|---|---|
| Total | 2404 | Total count of users who performed event A on June 28 |
| < 1 Day | 60.9% | Out of total 2404 users who performed event A on June 28 60.9% of them did event "B" or repeated on the same date |
| Day 1 | 26.12% | Out of total 2404 users what percentage of them did event "B" exactly 1 day later i.e out of 2404 users who did A on 28 June, 26.12% (628) users did B on 29 June. |
| Day 2 | 20.97% | Out of total 2404 users what percentage of them did event "B" exactly 2 day later, i.e. 20.97% users did B on 30 June. |
| Day 3 | 16.81%* | Out of total 2404 users what percentage of them did event "B" exactly 2 day later, i.e. 16.81% users did B on 1 July. Please note this is ongoing period as 1st July is not completed yet |
We do similar weighted average as count on top of percentage columns to find average N-Period Retention Percentage.
2. On And After Retention
This is similar to "On" retention except for fact that for each date and N-Period retention, we calculate how many users came ON and After N Day/weeks/months So for example for 24 Jun, day 3 retention would mean how many users came back on or after 3rd Day which includes 27th, 28th,29th 30th june and 1st July
Please note that < 1 Period is same day/week/month repeat hence does not include On and After Effect It will always consist of same period retained user and not after.
Since each day/week/month retention data would include users who came on as well as after the given period and includes all future users too, so it will always be strictly decreasing.
a) Count
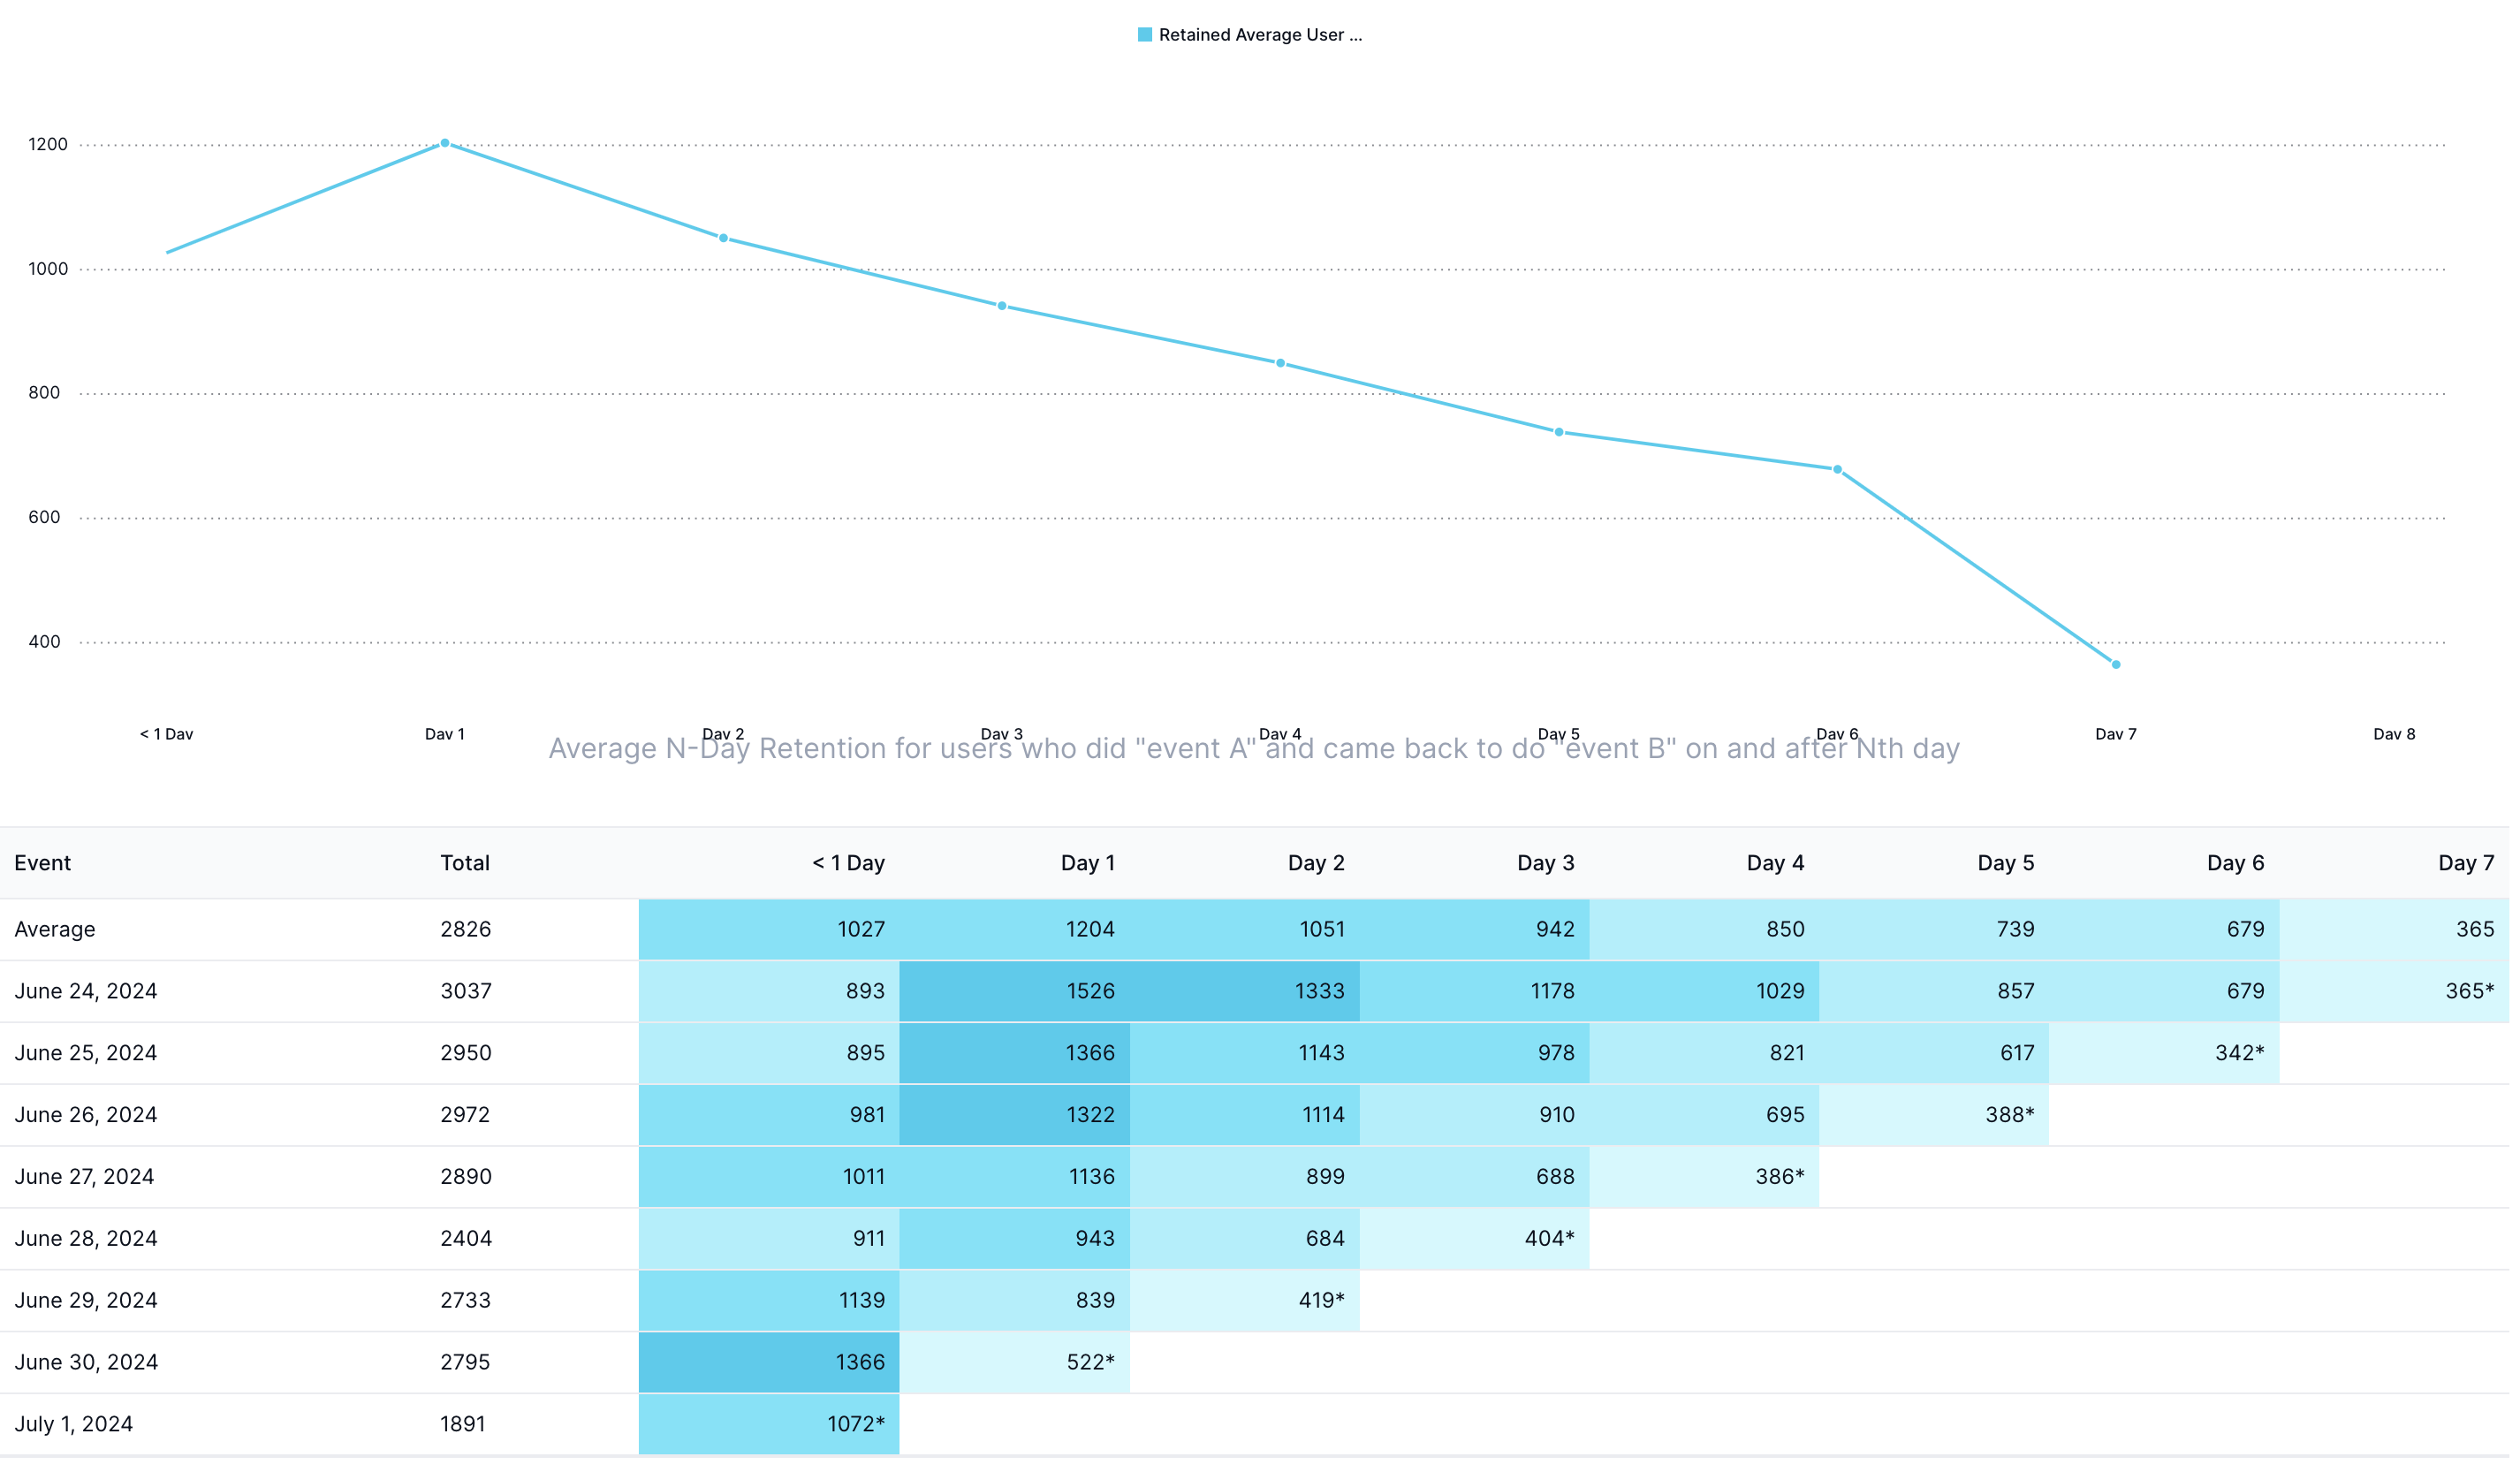
Let us take example of June 28 2024 as before, where there are data for Total, < 1 Day, Day 1, Day 2 and Day 3.
Total will remain same as 2404 users who did event A on 28th Jun.
< 1 Day will also remain same as 1464 as same period retention will not include future values.
Day 1 is now 943 users for 'on-and-after' as compared to 628 in 'on' as it included users who performed event A on 28 jun and came back and did event B on and after 29 Jun (29 Jun, 30 Jun and 1st July)
Day 2 is now 684 users as compared to 504 for 'on' retention. as it includes users who came back on 30 June as well as 1st July rather than only 30 June in case of "on" retention
Day 3 remains same as 404* as it is ongoing period and there is no period after it. So on as well as on-and after will denote users who did A on 28th and came on 28Jun + 3Days = 1st July.
To generalize, data will remain same in case of 'on' vs 'on-and-after' for Total, < 1 and on-going period.
b) Percentage
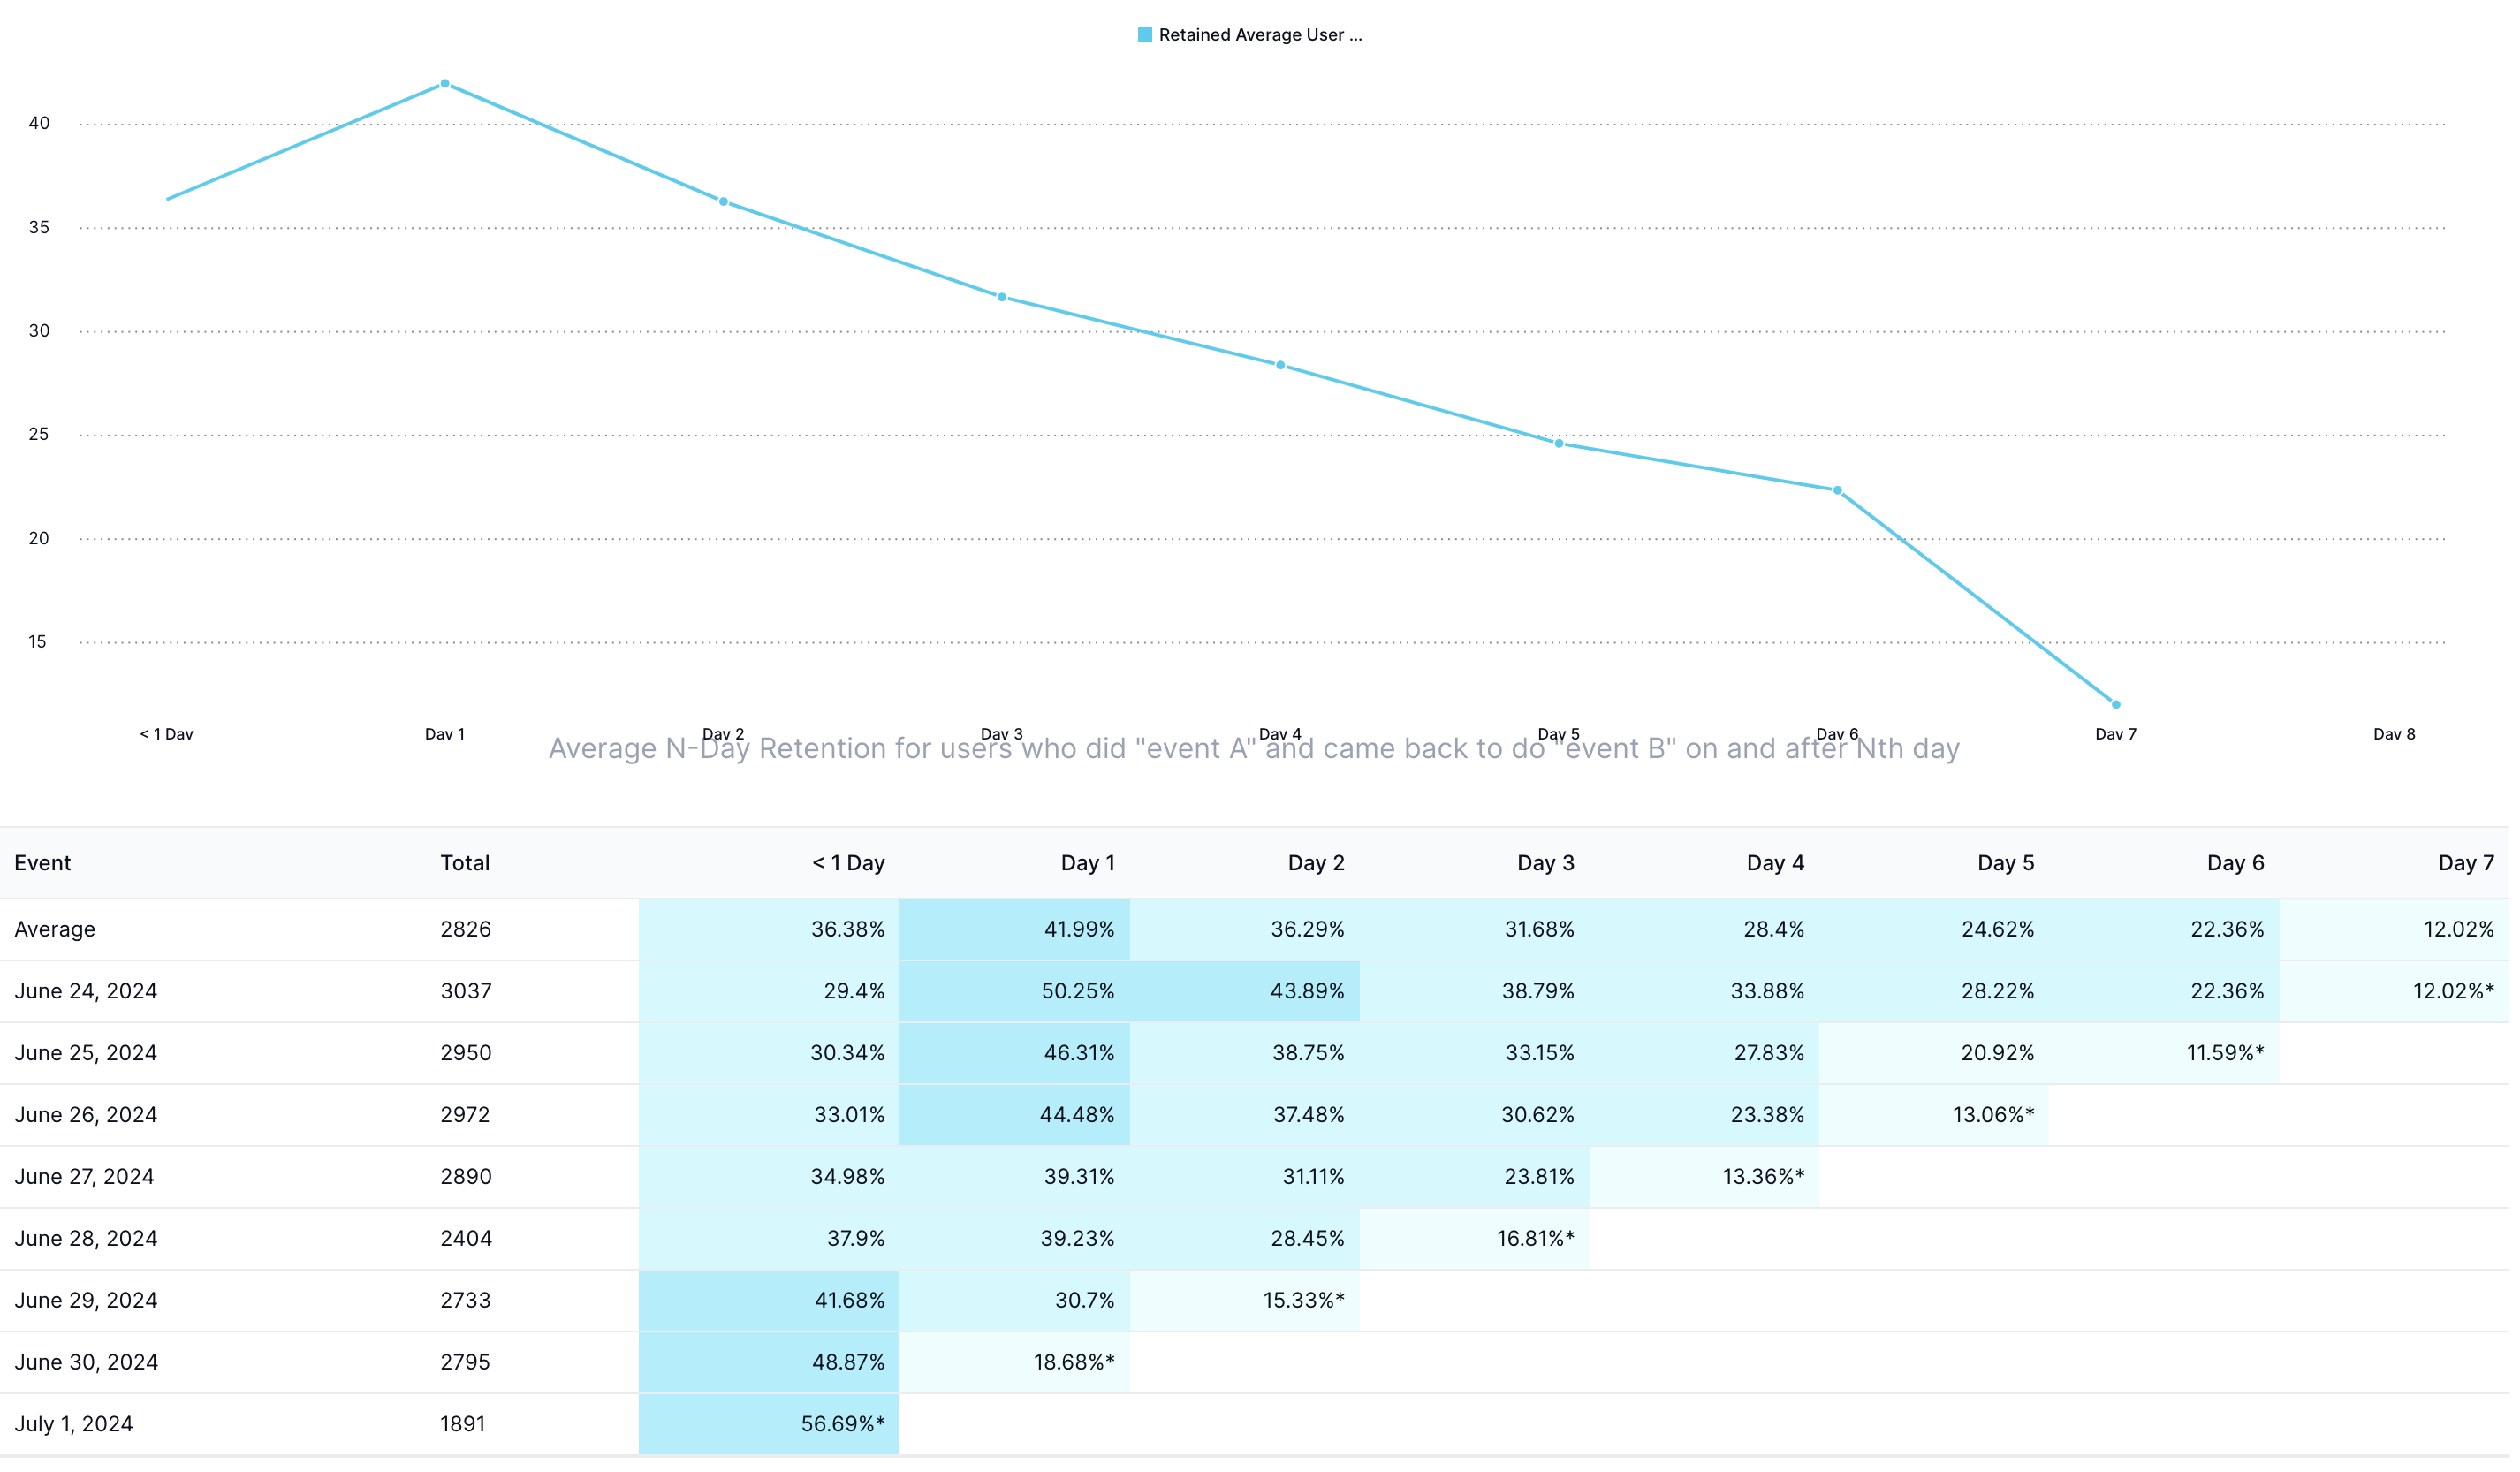
Very similar to count, percentage will now depict what percentage of users who did event A on given date came back On or After N days/weeks/months.
Also note that this graph will be strictly falling graph as previous periods will include their own as well as future periods' users.
Average and Graph
The logic for weighted average in 'on-and-after' will remain similar to 'on' retention and graph will also represent average row data. In essence, it would now represent for given time range What is the average user count or percentage who come back and perform event B on or after N days/weeks/months from their initial date of performing event A.
Repeat vs Retention-Curve
While both can be used to understand user retention here are some key points to keep in mind wile using them
- Retention-curve compares retention for each date over all future periods/dates while repeat compares a given date from immediate previous/adjacent period only.
- Retention-curve is forward-looking data and compares to future periods while repeat is backward-looking and compares from previous period and window.
- Retention-Curve graph denotes on average how many users come back after N-periods (with N varying over x-axis) from their initial event A interaction and does not give date wise view as how my retention is falling or increasing over calendar days or weeks or months. Repeat on contrast shows repeat from previous window for each calendar day/week/month (with calendar dates on x-axis) and can flag easily from graph for retention issue in any given calendar date(or week or month) over queried time range.
- Repeat check repetition on same event only, there is no option to have different initial event A and retention event B like in Retention-Curve. However in repeat you can add multiple charts (like B, C , D) and compare their repetition together in a graph like in image below -
